


Stay informed about what matters in crypto. Forget the noise. Get free market-leading crypto research by subscribing to Re7 Capital’s research below:
About Re7 Capital
Re7 Capital is a research-driven digital asset investment firm specialising in DeFi yield and liquid venture strategies.
Summary
In this edition, we cover:
Key market trends Re7 has observed over 2023 across:
Market performance
Stablecoin supplies
Spot volumes
Bridging
NFT experimentation
Liquid staking derivatives (LSDs)
As we fast approach year-end, there’s no better time to reflect on some of the key, but easy-to-digest, trends we’ve been observing in 2023.
Notable developments can be seen at the highest level, the micro, and cross-sector - and we highlight just a fraction of these in this week’s YE article.
We look forward to seeing what 2024 brings.
YTD Performance
We start with a headline trend - performance. Overall, it’s been a very positive year for the industry, with the broader environment generally being conducive for risk assets.
Crypto has printed an impressive +97% YTD performance following the -65% 2022.
The global cryptoasset market capitalisation has grown from 773B to $1.5T.

The take: 2023 was a year where the cryptoasset market echoed the seasonality of the equity markets.
Stablecoin Supplies
On-chain stablecoin supply declined 16.6B from January 2023 to its low in October (110B).
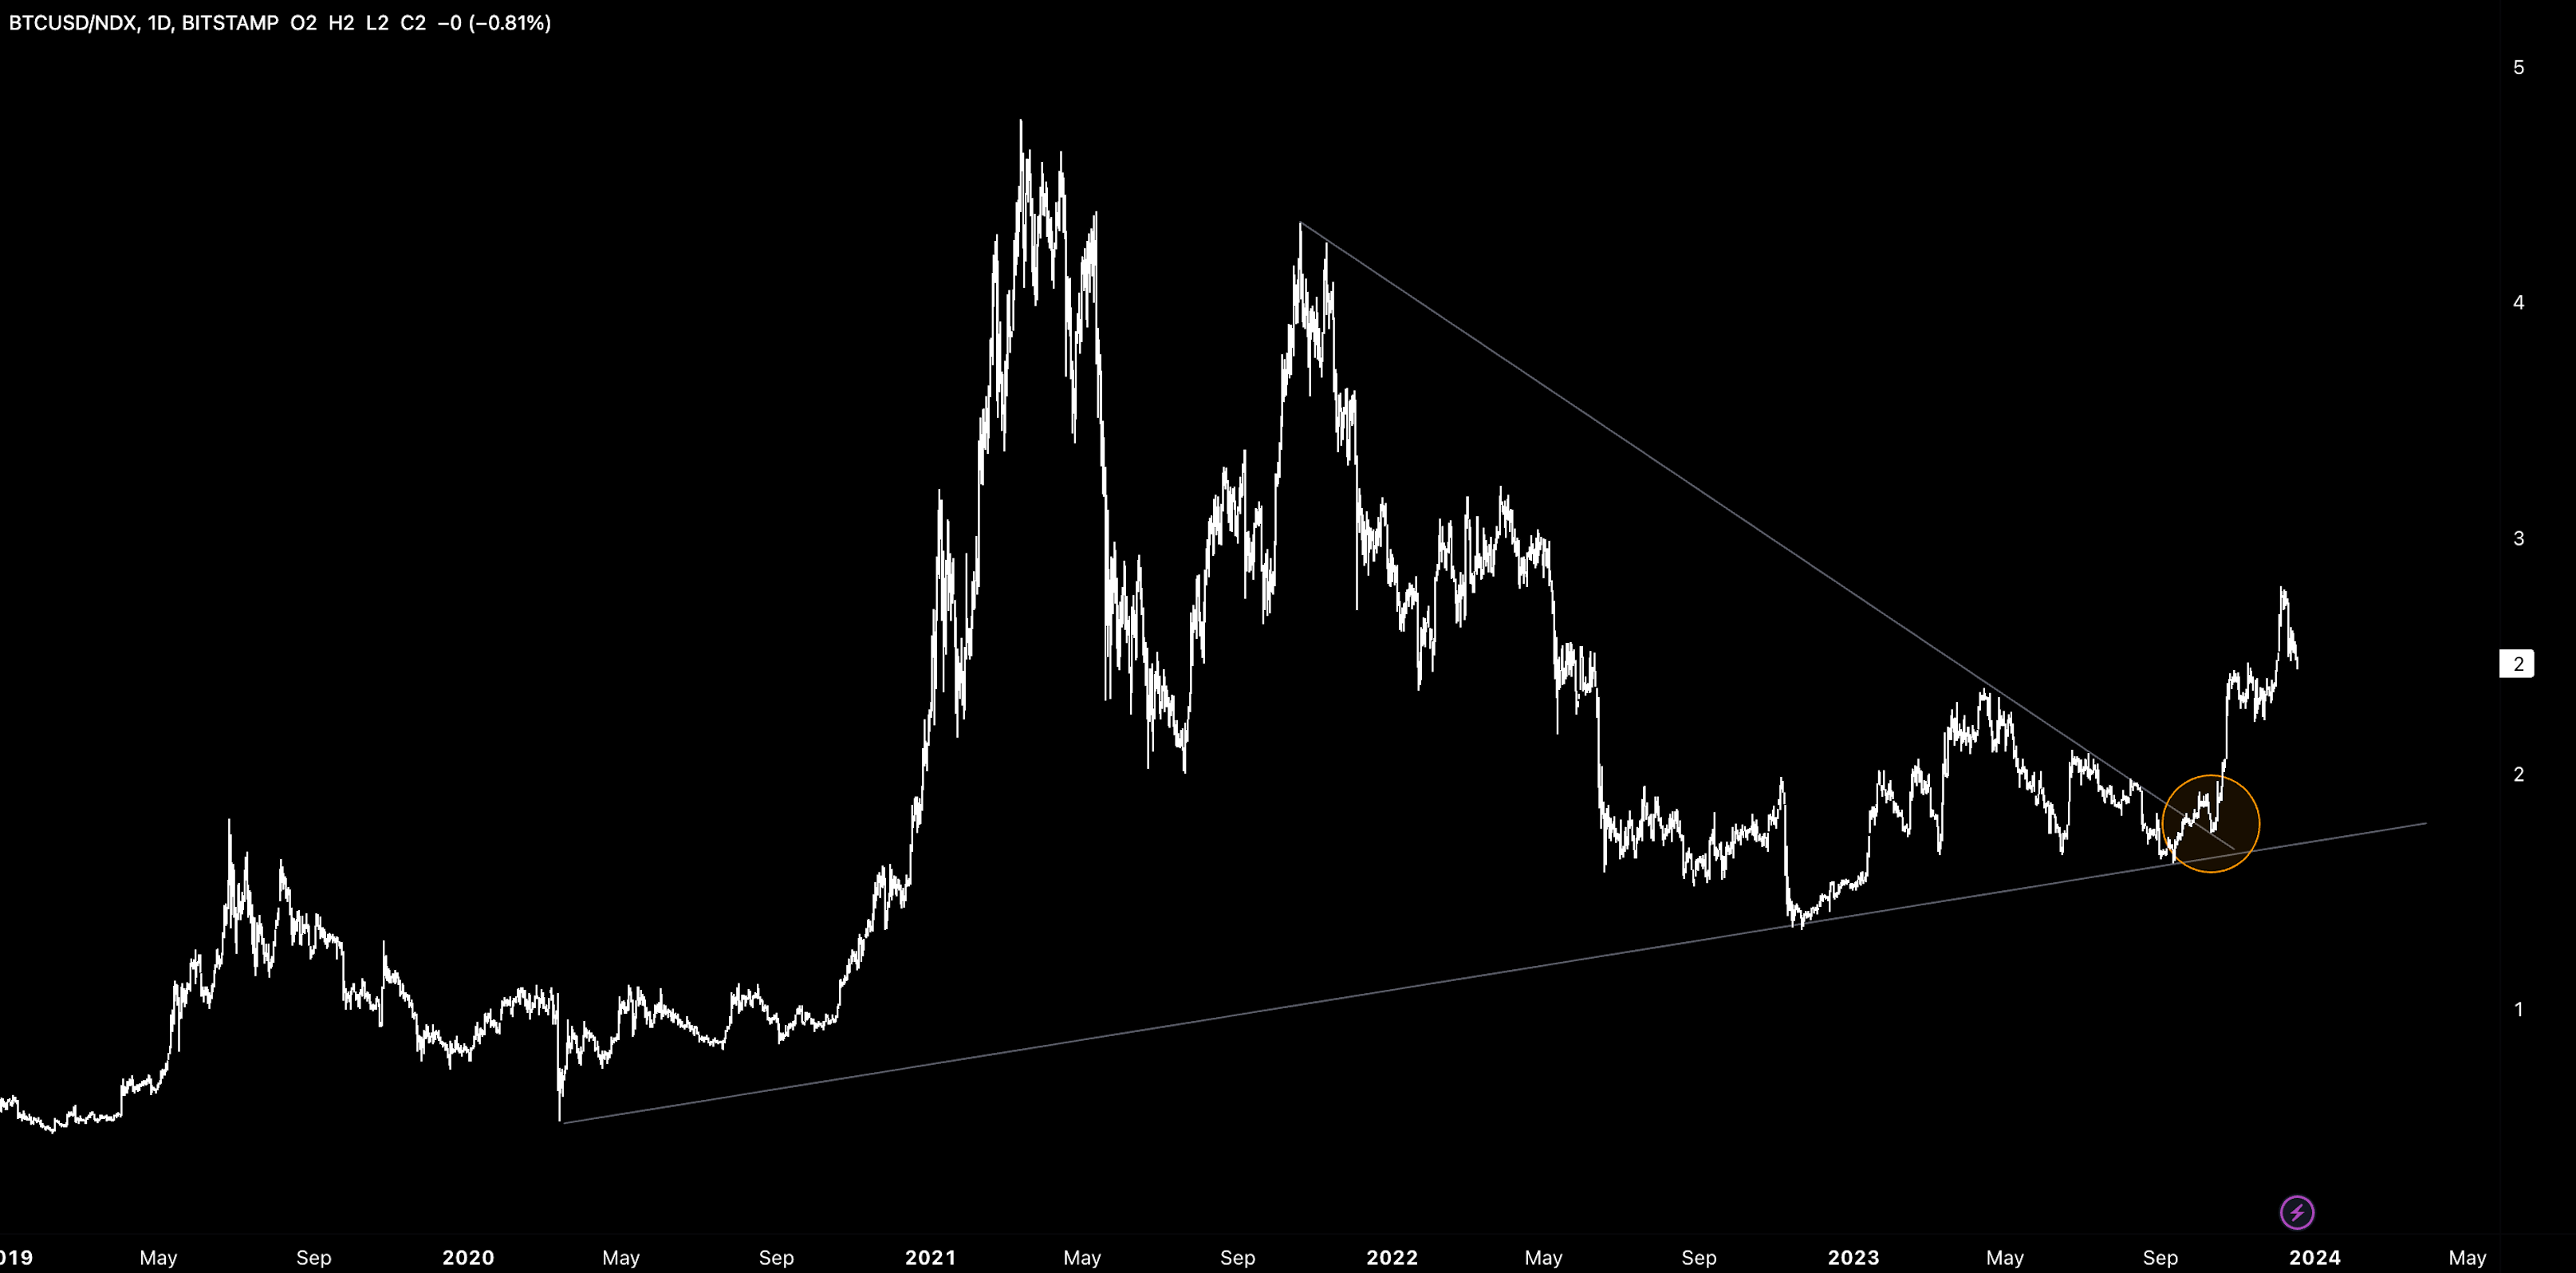
Since then, we’ve seen a 6B growth in stablecoin supplies around the time when US treasury yields topped out at 5% (grey line) as investors saw little room left for further rate increases.
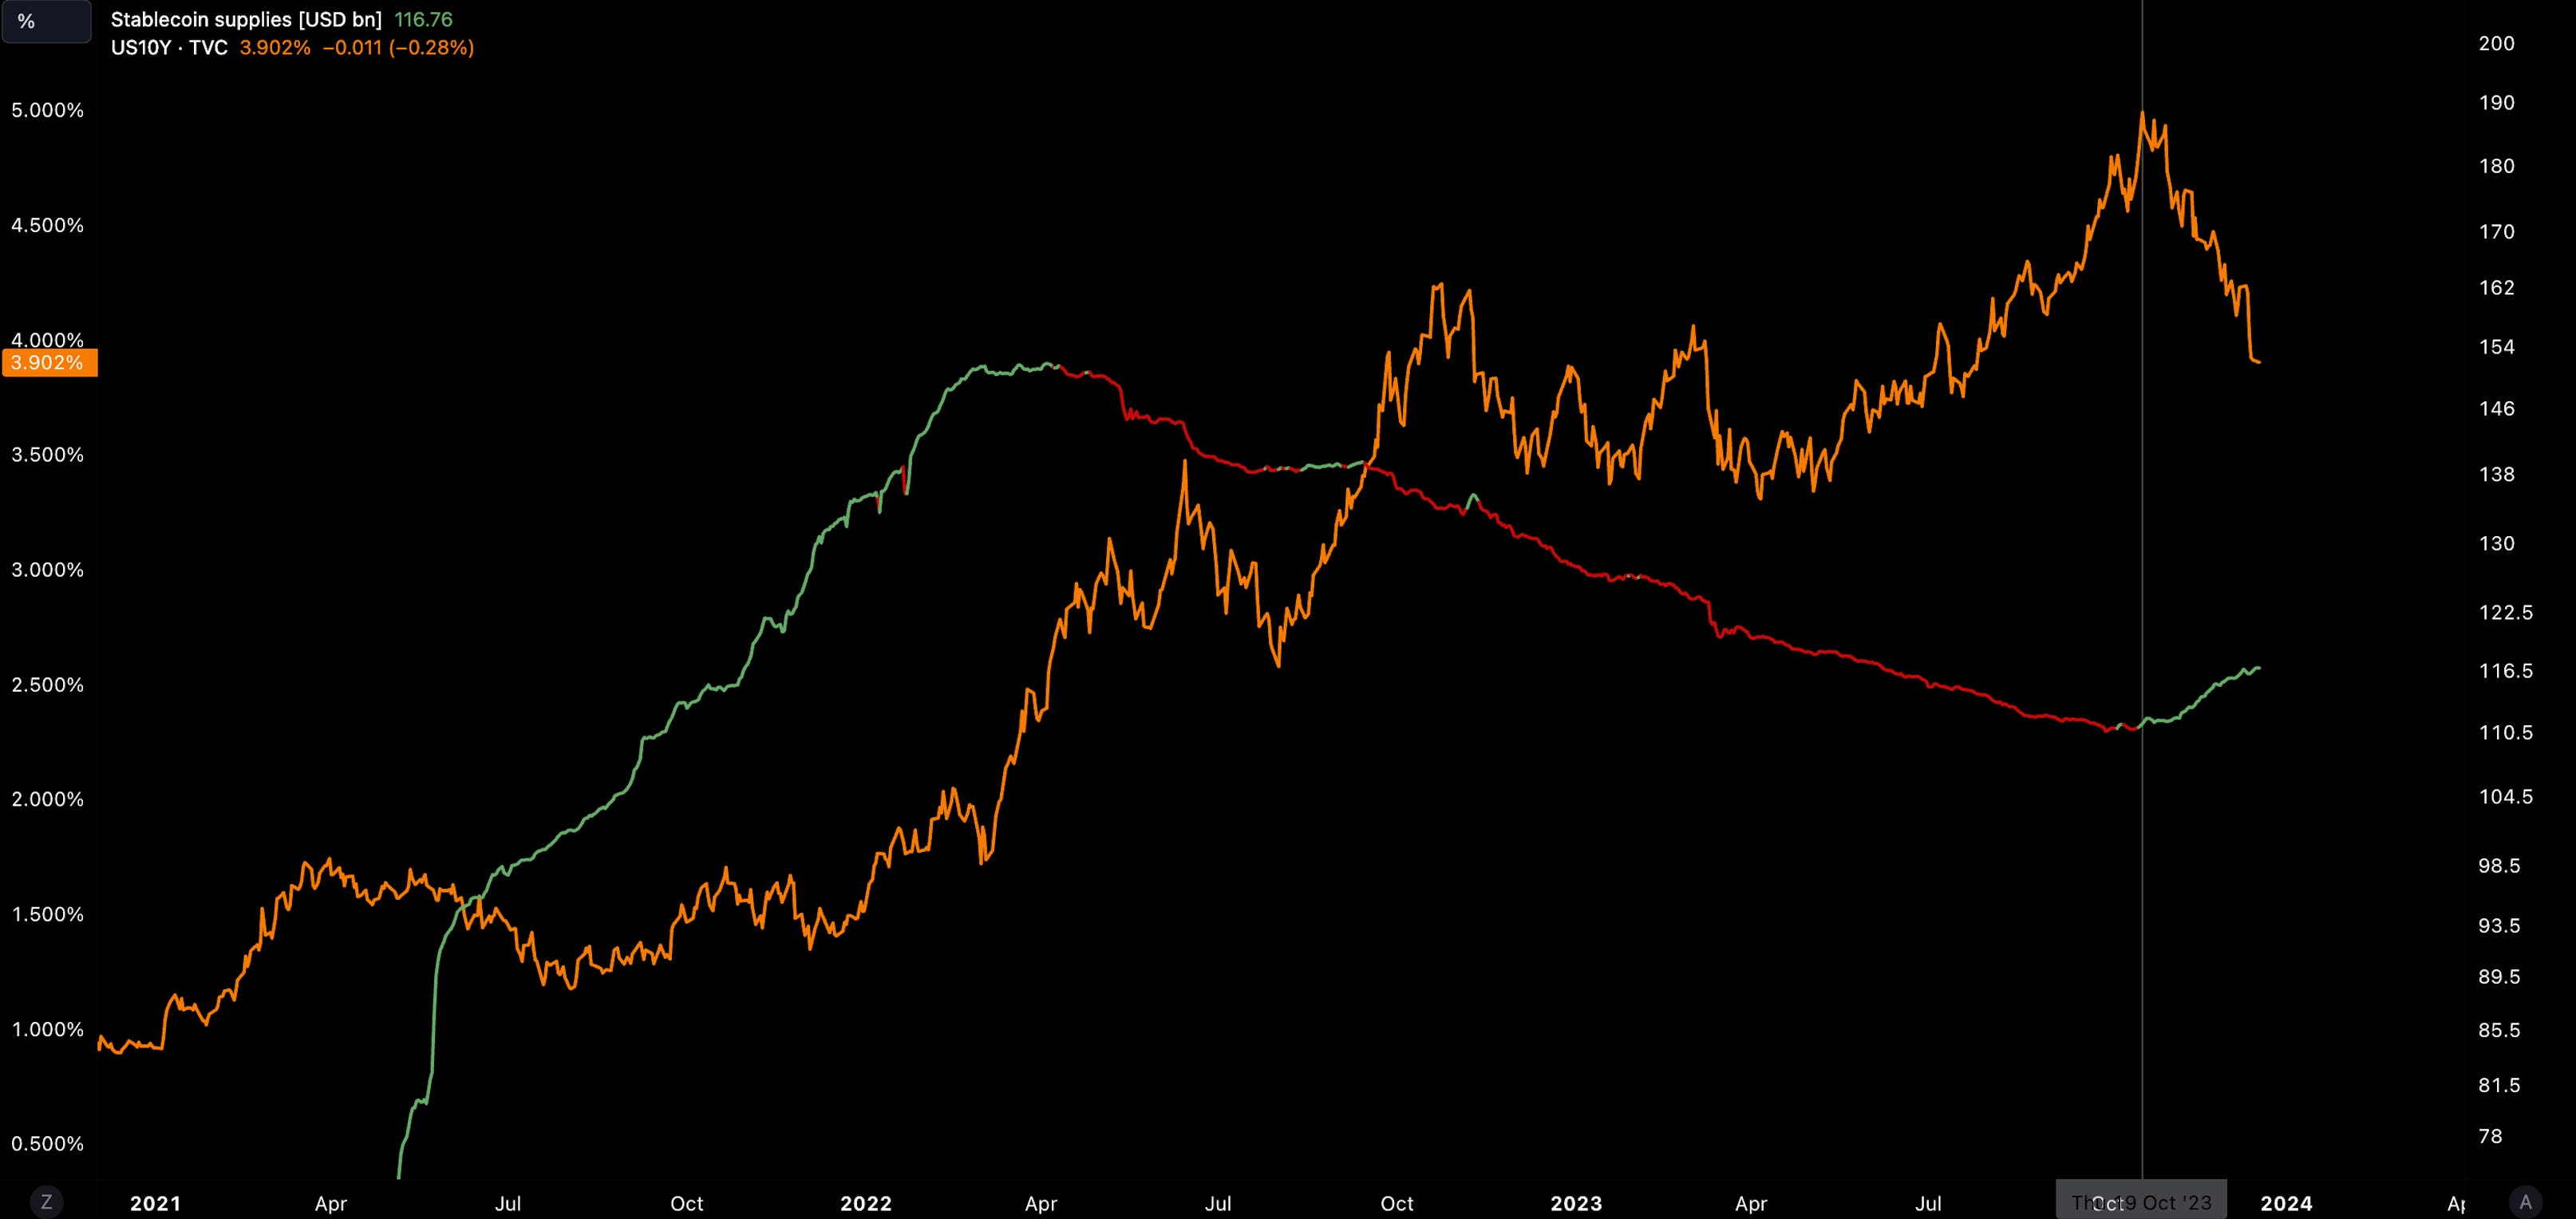
This was also the exact time when crypto beta (BTC) broke out against high-growth tech indices (e.g. NDX) to the upside.
The positive reversal in stablecoin supply signals net new inflows into the cryptoasset market as risk premium starts to increase.
The take: 2023 was a year split into two: a half when the opportunity cost to participate in DeFi yields decreased, and a half when the opportunity cost increased (where we find ourselves today).
Daily spot volumes
Daily spot exchange volume formed a U-shape with volumes initially climbing to $30-$40B.
The summer lull seasonality took over with volumes dropping to lows of $10b (-75%) before re-charging back up to Q1 levels more recently.
This rebound has led Goldman recently to expect a “significant uptick” in cryptoasset volumes over the years where there has been a “huge appetite” for cryptoassets.
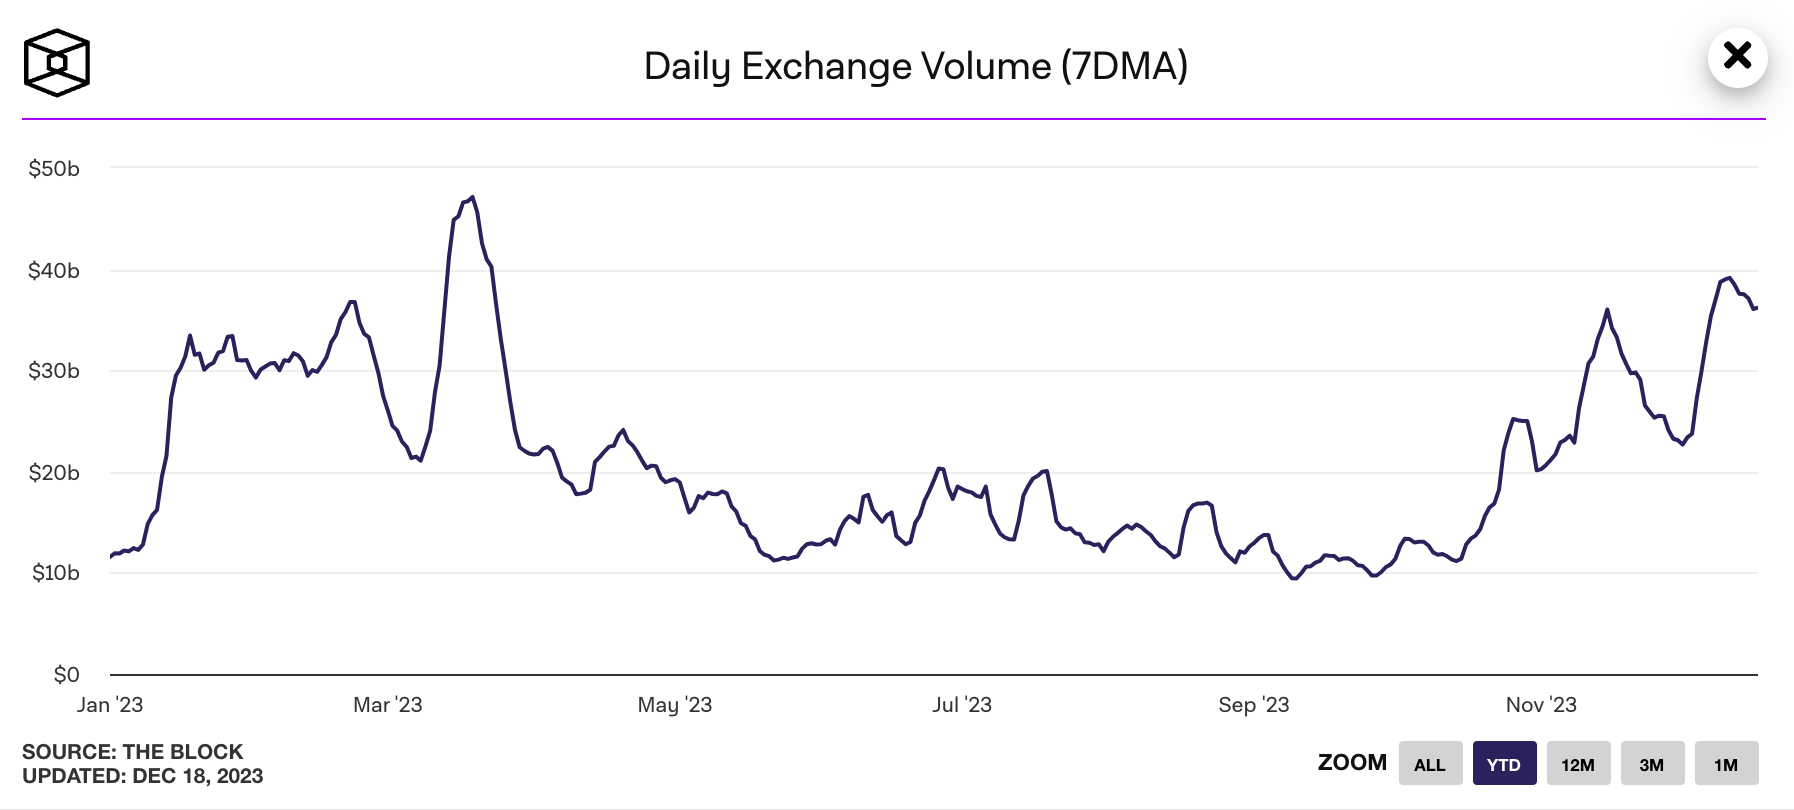
The take: 2023’s U-shape curve for volume reflected the ‘cautious’ investor sentiment that was prevalent following the initial recovery.
Bridge volumes
There are now 23 blockchain ecosystems with total value-locked over $100m.
Three years ago, Ethereum dominated liquidity at 95% market share. Today, it represents <56%. The multi-chain thesis is no longer a thesis but a reality.
One of the challenges with this growing number of disparate ecosystems is the need to connect users, liquidity, and developers (akin to islands needing ferry shipments between ports).
On the surface, bridge volume has remained remarkably flat at $200M/daily ($73B).
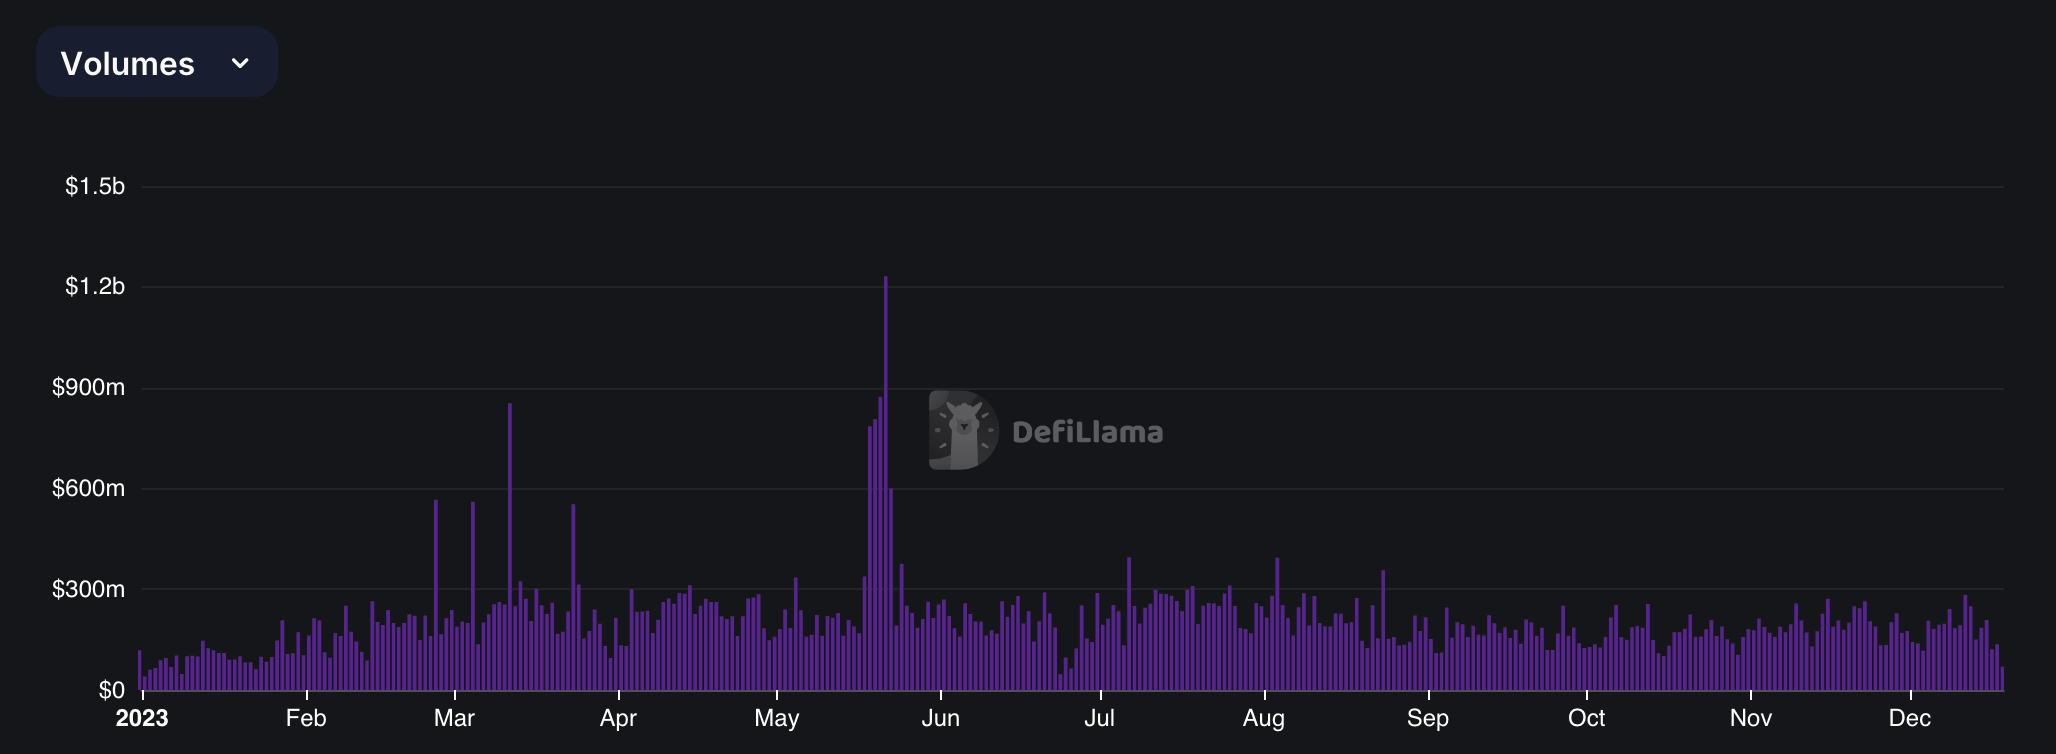
However, by digging deeper into the data, we can see certain bridges that are optimised for low-cost and speed gew their volumes 10x YTD.

The take: 2023 was the year for low-cost, fast bridges. The year saw multiple highly anticipated ecosystem incentive programs where efficient bridge infrastructure was able to capitalise on the growing need for users to participate in those programs.
NFT Experimentation
Total monthly NFT mints remained relatively flat throughout 2023 at ~30-40M.
The combination of Solana’s low network fees and the advent of compressed NFT technology in March 2023 catalysed market dominance for NFT minting.
Solana is now driving ~100% of the total NFT mints from EVM chains as a single ecosystem.
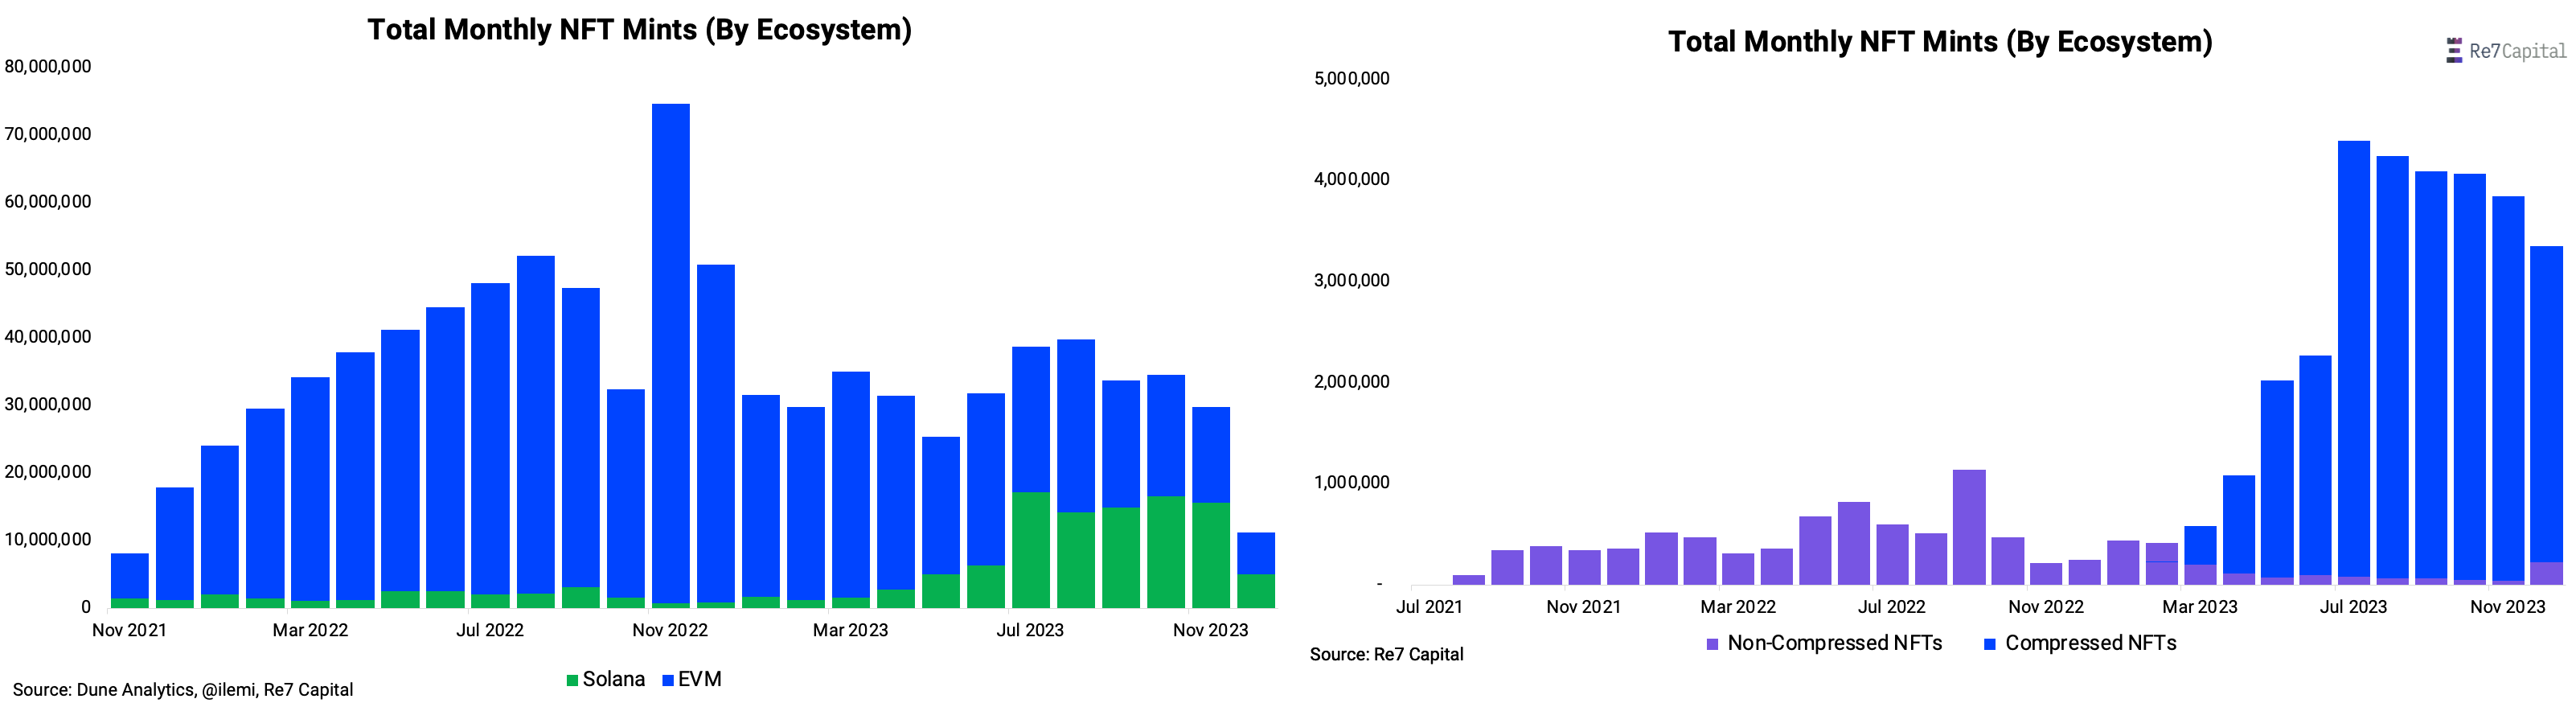
Use cases at the application layer have leant into Solana’s low-cost minting dynamic with projects like DRiP enabling creators to send digital gifts to supporters every week.
It’s not just NFT mint count that’s higher on Solana than EVM chains. Solana NFT marketplace volumes have recently surged to $1.5B/month (3x that of Ethereum’s).

The take: 2023 was the year for scalable NFT infrastructure. Solana became a key home for NFT experimentation. The ability to mint millions of low-cost NFTs will enable more use cases as the cost of distribution falls dramatically.
Liquid Staking
Liquid staking derivatives remained a key narrative throughout 2023.
The percentage of ETH circulating supply in LSDs grew from 4% to 10%. Over 37% of the total ETH staked has been done via liquid staking derivative platforms. Meanwhile, centralise exchange LSD dominance fell from 36% to 28%.
Decentralised platforms with broader accessibility and more efficient cost structures are winning.
The real story though, has been the growing supply of alternative ecosystems in LSD platforms. For example, the % of ATOM, OSMO and SOL supply in LSDs are all reaching new ATHs as users seek liquidity while retaining their yield opportunity.

The take: 2023 became the year when the focus of liquid staking derivatives moved away from being just an Ethereum-centric narrative. Rather, it was always going to be a proof-of-stake-centric narrative.
Spotlight
Re7 Featured on Token Terminal’s podcast, Fundamentals.
Token Terminal and Evgeny dive into the vast arena of DeFi, exploring everything from generating yield to managing risks, discussing the intrinsic value of crypto, how investors should approach valuing multidimensional cryptoassets, and what Re7’s edge is in the space.

What's Next for MakerDAO's Real-World Assets?

MakerDAO has over 60% of its backing as Real World Assets, with most of those in the form of treasury bills deposited in the Clydesdale and Andromeda structures.
These assets earn the majority of the protocol's revenue and have helped subsidize the 5% DAI savings rate that Maker is currently providing at a loss.
Despite the DSR, MakerDAO has turned profitable this year on the back of the RWA yield.
With the rate outlook flat to down over the next year, it remains to be seen how the protocol will maintain the juicy revenues it's enjoyed the past months.

Global Market Cap
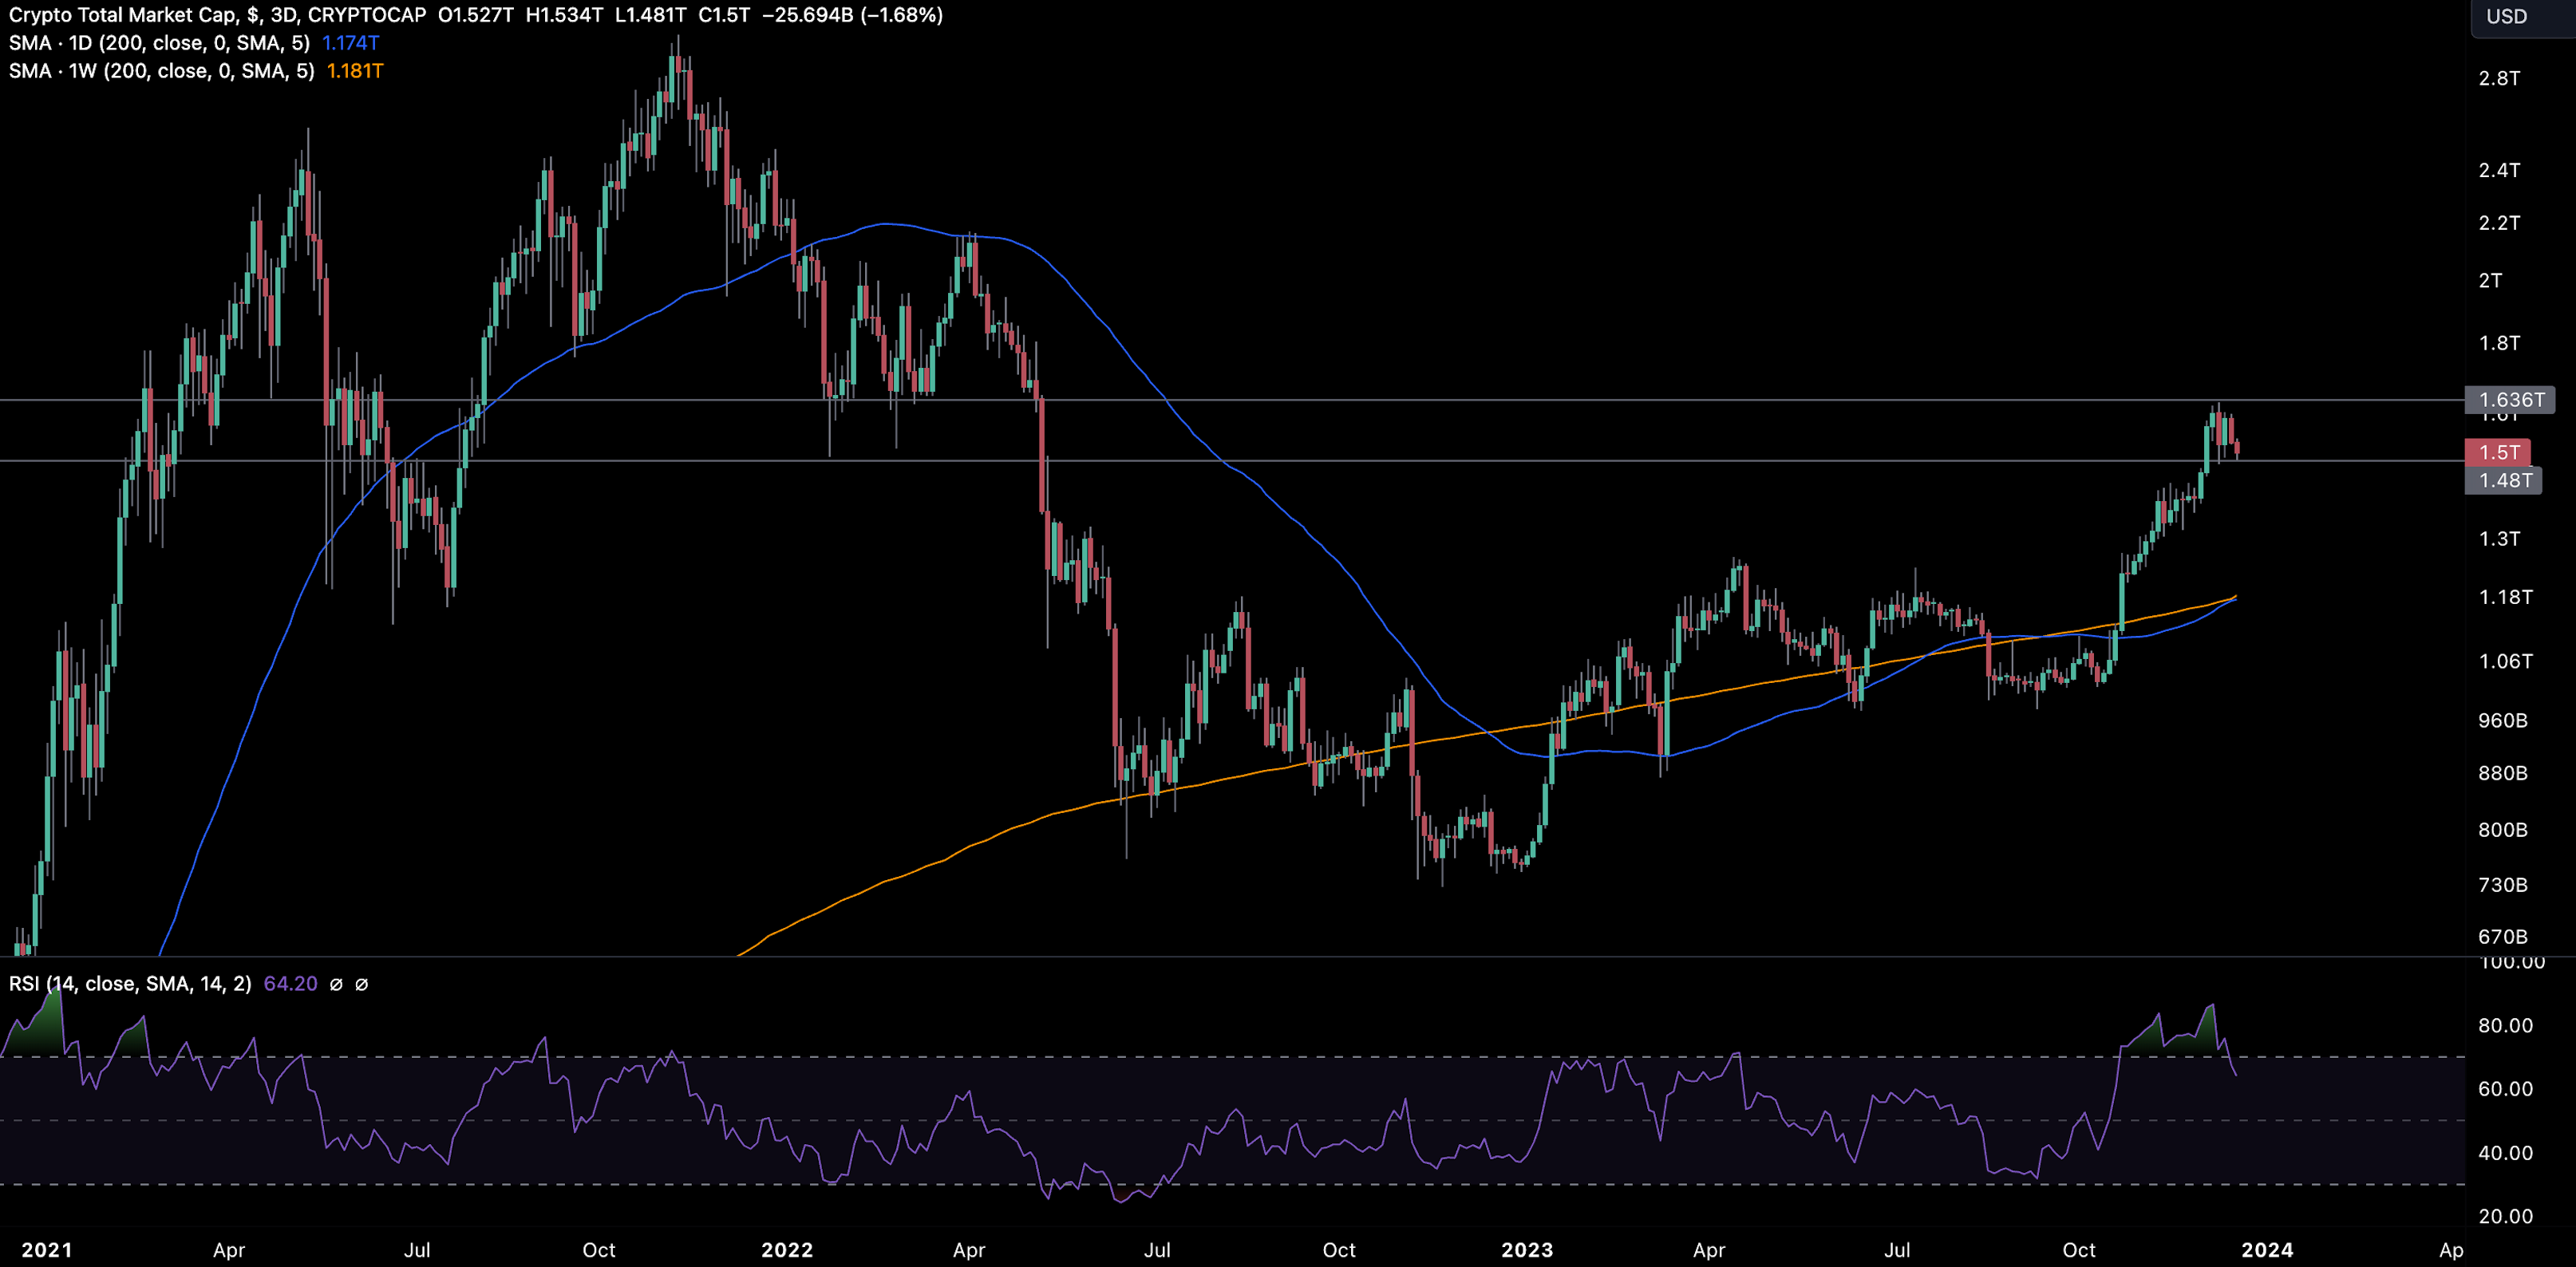
$1.50T; Markets have retraced 7.6% from its resistance of ~$1.63T (Q1 2022 close level). Found initial support at January 2022’s support with daily RSI neutralised at 50.
Liquidity
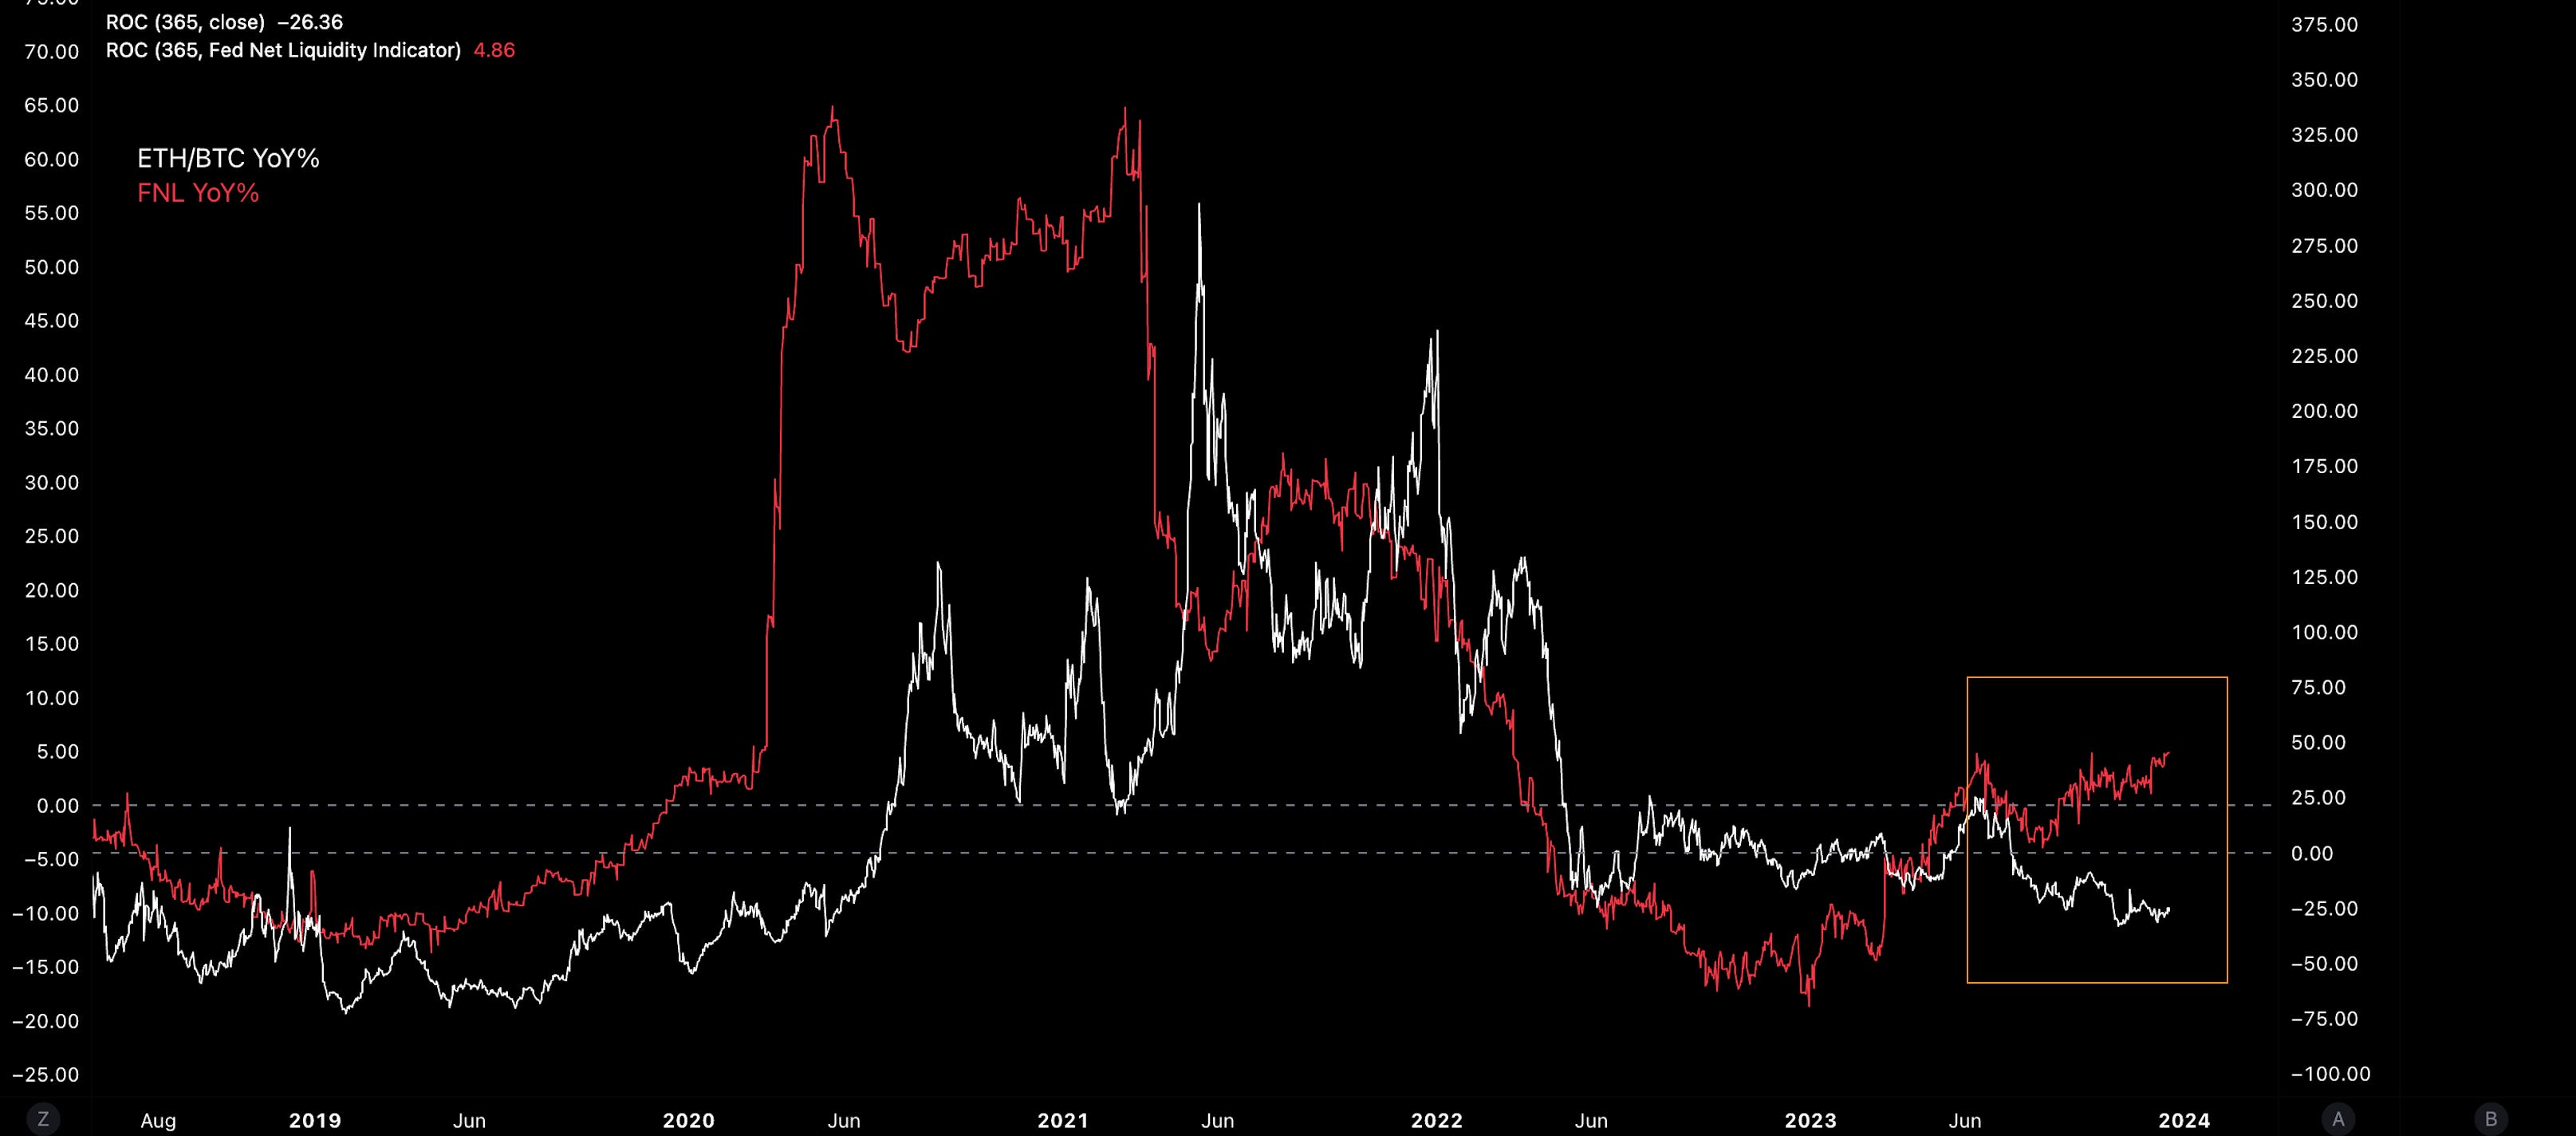
Growth in US domestic liquidity has historically correlated with performance in the ETH/BTC cross. Since summer, liquidity measures have not translated into corresponding ETH/BTC performance likely reflecting BTC-centric positioning heading into possible ETF approvals in January 2023.
ETH/BTC

0.052; ETH/BTC is still keeping within its wedge pattern but sticking to the lower support - refusing to break down relative to BTC for now.
DeFi

$62.97B; DeFi broke out of its ascending channel to the upside. After finding resistance at $66B, we watch for potential support at $60B - the support area during 2021.
Bitcoin Dominance

BTC.D; No material change in Bitcoin dominance from last week. Dominance is struggling to sustain a break above 54% - support during the 2018-2019 period.
Trader Positioning
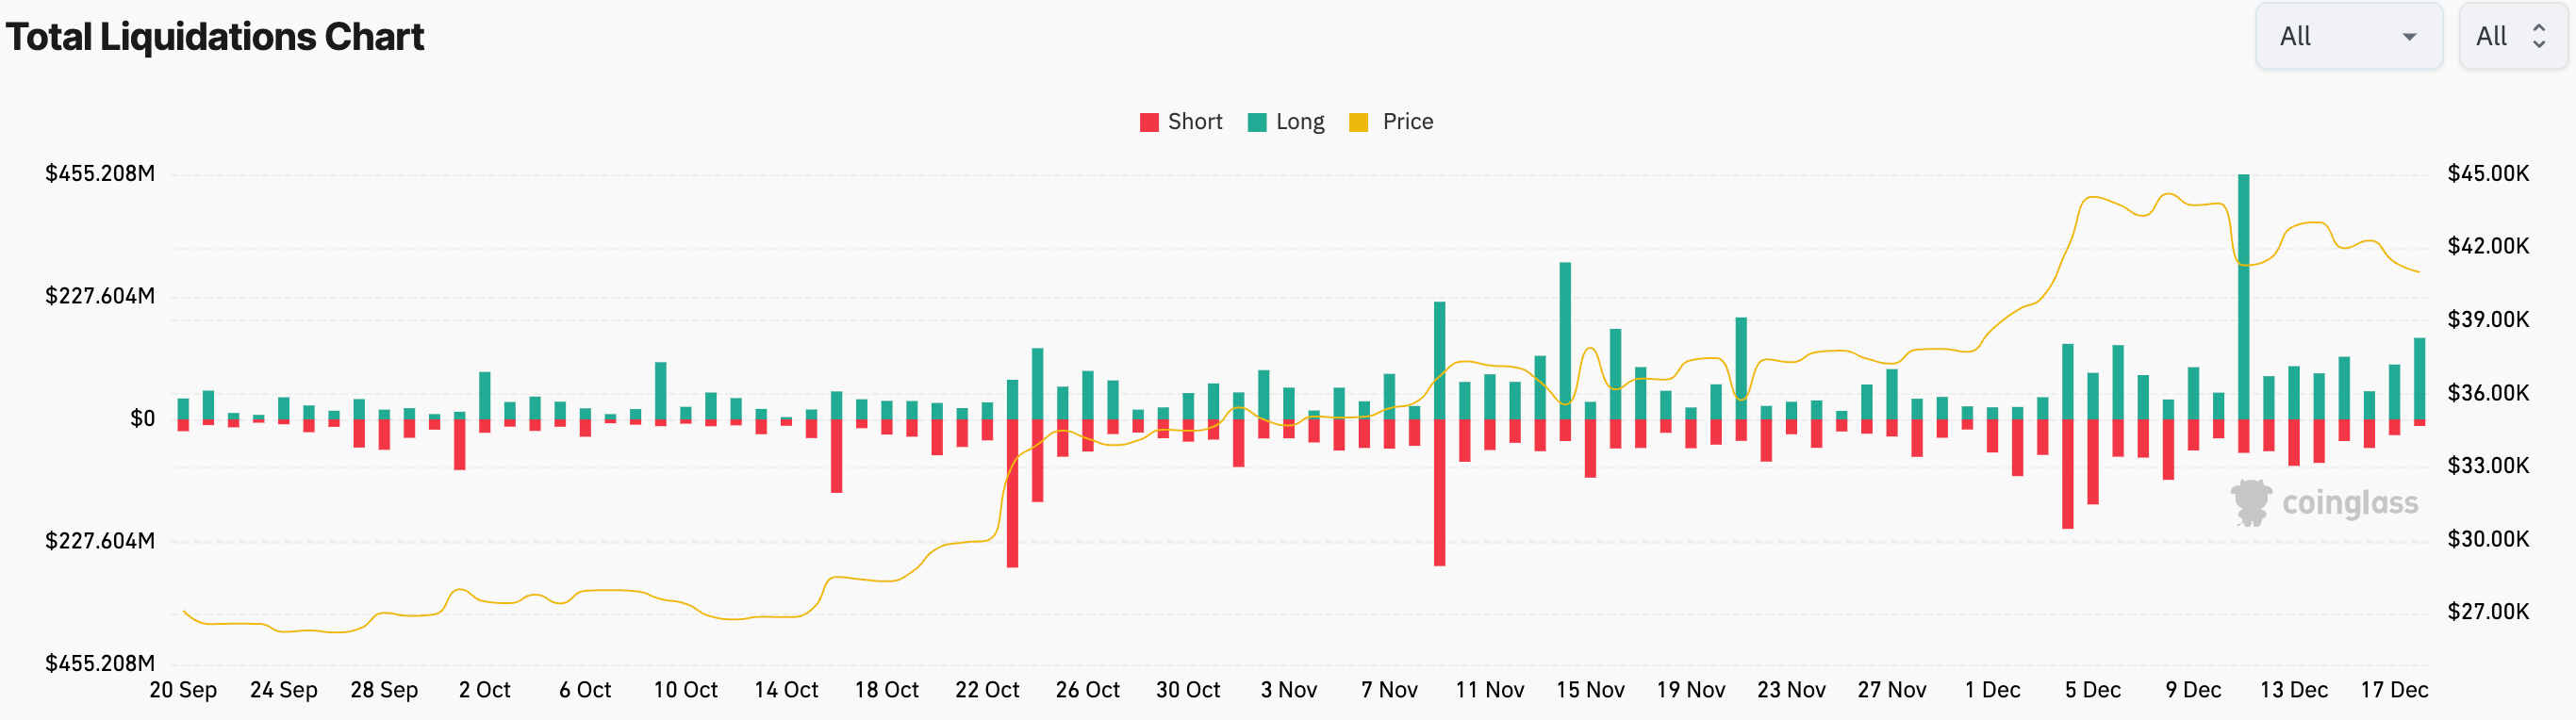
We are still seeing $100m+ daily long liquidations with long liquidations often representing 5x the volume of shorts.
BTC OI-weighted funding rates have remained elevated/positive at 0.01% despite liquidations with traders continuing to take a predominantly bullish stance. Long liquidations may still induce vol spikes if a full funding rate reset has not occurred.


> How Sui Achieves 270k TPS [Fundamentals]
> Andre Cronje Unfiltered [Lightspeed]
> Data Availability Bake-off [Bell Curve]
> DLC Link - Self-Wrapped Bitcoin [Epicenter]
> What to expect from Web3 in 2024 [The Metaverse Podcast]

> Bitcoin Inscriptions [0xCygaar]
> The Great Wealth Transfer & its Impact on Crypto [Galaxy]
> Volume 162: Digital Asset Fund Flows Weekly Report [Coinshares]
> Arweave Fork [Samcwilliams]
> OurNetwork: Gaming [OurNetwork]
Disclaimers
The content is for informational purposes. None of the content is meant to be investment advice. Use your own discretion and independent decision regarding investments. The opinions expressed in all Re7 public research articles are the independent opinions of the authors at the time of publication and not the opinions of the affiliates of Re7.
Please see here for full disclaimers.