


The Weekly - 1st November 2023
Markets get a meaningful lift as higher liquidity and enhanced product utility is catalysing the next adoption cycle.


Stay informed about what really matters in crypto. Forget the noise. Get free market-leading crypto research by subscribing to Re7 Capital’s research below:
About Re7 Capital
Re7 Capital is a research-driven digital asset investment firm specialising in DeFi yield and liquid venture strategies.
In this edition, we cover:
The technical setup and the relative strength of Bitcoin
How the technical outlook will be realised:
via Spot Bitcoin ETF flow models
via market liquidity
via enhanced cross-sector utility (DeFi, infra) and the implications through the lens of Re7’s network valuation models.
Technicals Are Constructive
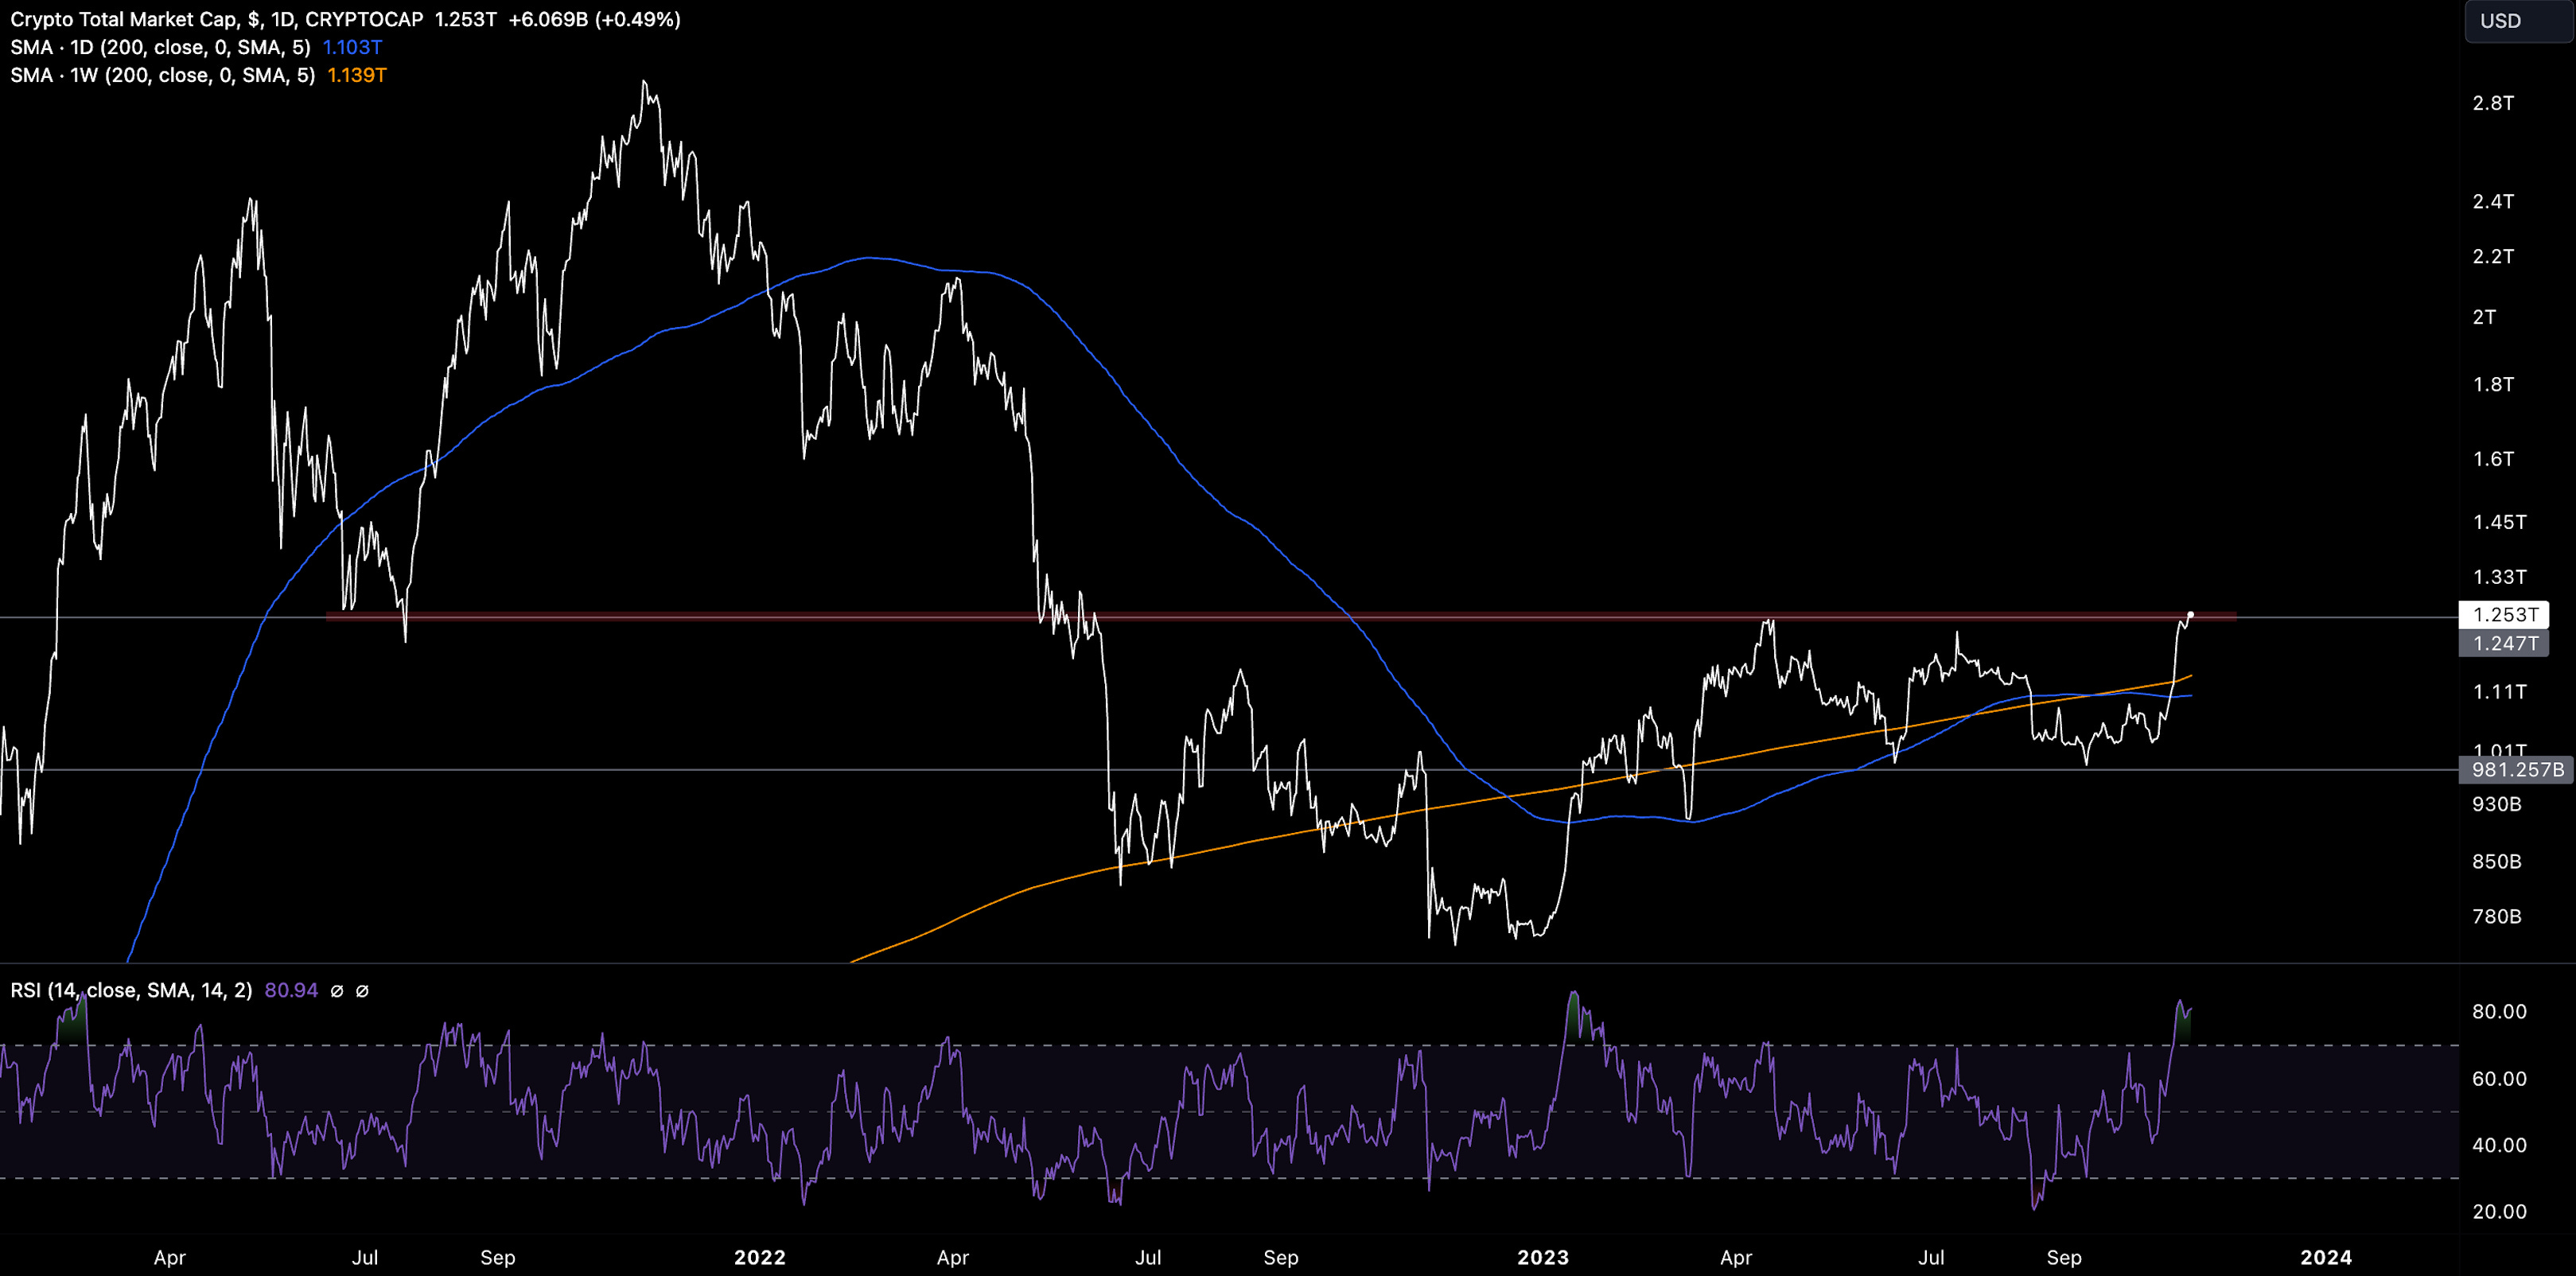
It was a very positive week for the cryptoasset market with total market capitalisation surpassing $1.25T - a key channel resistance area since April 2023. As we noted last week, the upside momentum was so strong that reliable longer-term indicators like the 200d MA were broken.
Last week’s performance was driven by a combination of strong spot bids and short liquidations in the futures market exacerbating volatility with all crypto sectors booking gains.
For the week ahead, prices look overextended with Bitcoin moving 4 standard deviations higher in the last week. However, as we’ve seen throughout 2023, you can have small price retraces only for the broader trajectory being higher.
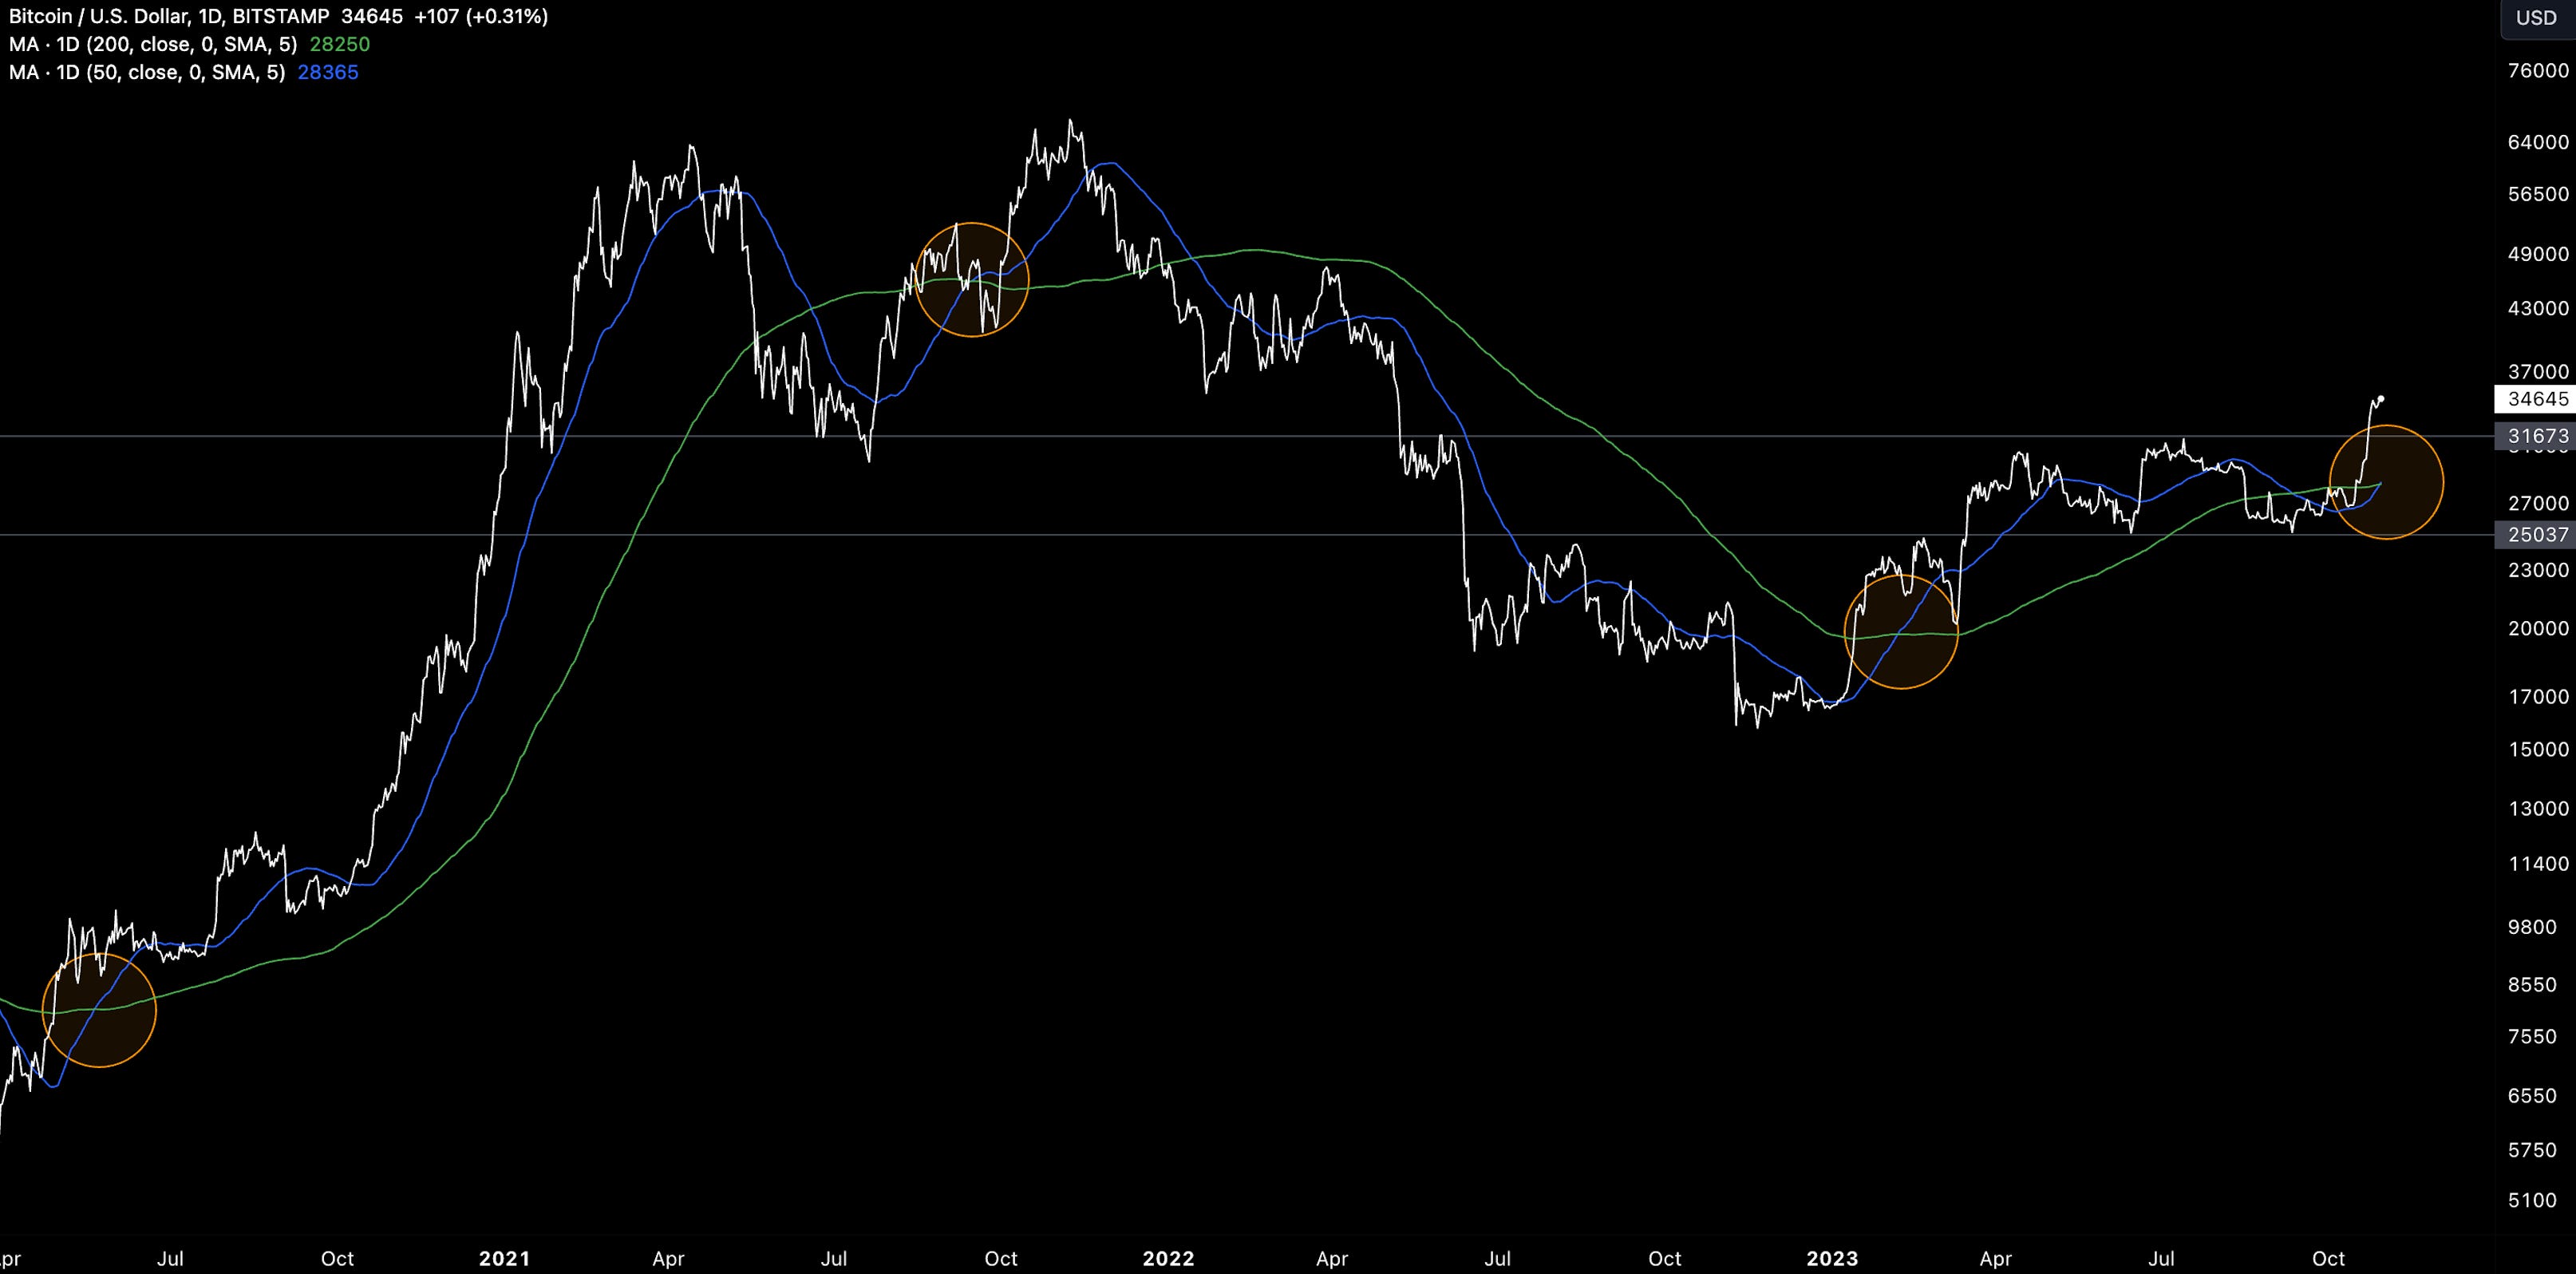
For BTC, we saw new 2023 highs of $35,198, breaking out of its own 2023 channel to the upside, but failing to close above the January 2022 low of $35k. What is notable is Bitcoin’s golden cross print last week (50d SMA crossing above the 200d SMA):
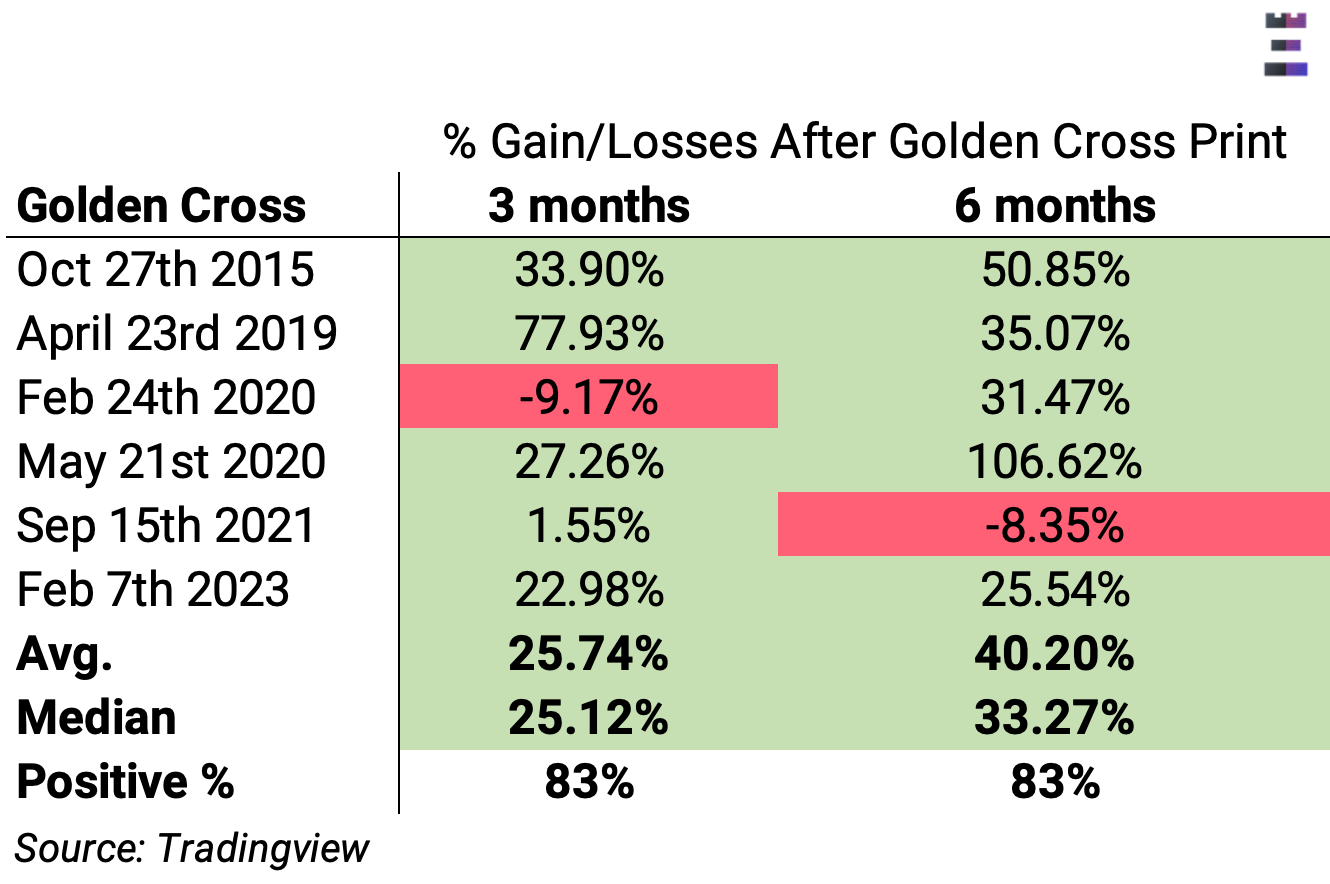
Since October 2015, BTC more often than not follows a medium-term uptrend after the golden cross event as we can see below in a 3 and 6 months gain/loss analysis:
Fund Flows Realizing The Technical Outlook
Sizing the spot Bitcoin ETF
The next logical question here is what could drive positive performance where history can rhyme once again. One is the spot Bitcoin ETF approval in the US. Why a Bitcoin ETF matters are that it would 1) legitimise the industry further through formal recognition by regulators and asset managers and 2) expand the accessibility of Bitcoin (and eventually further cryptoassets) across wealth segments.
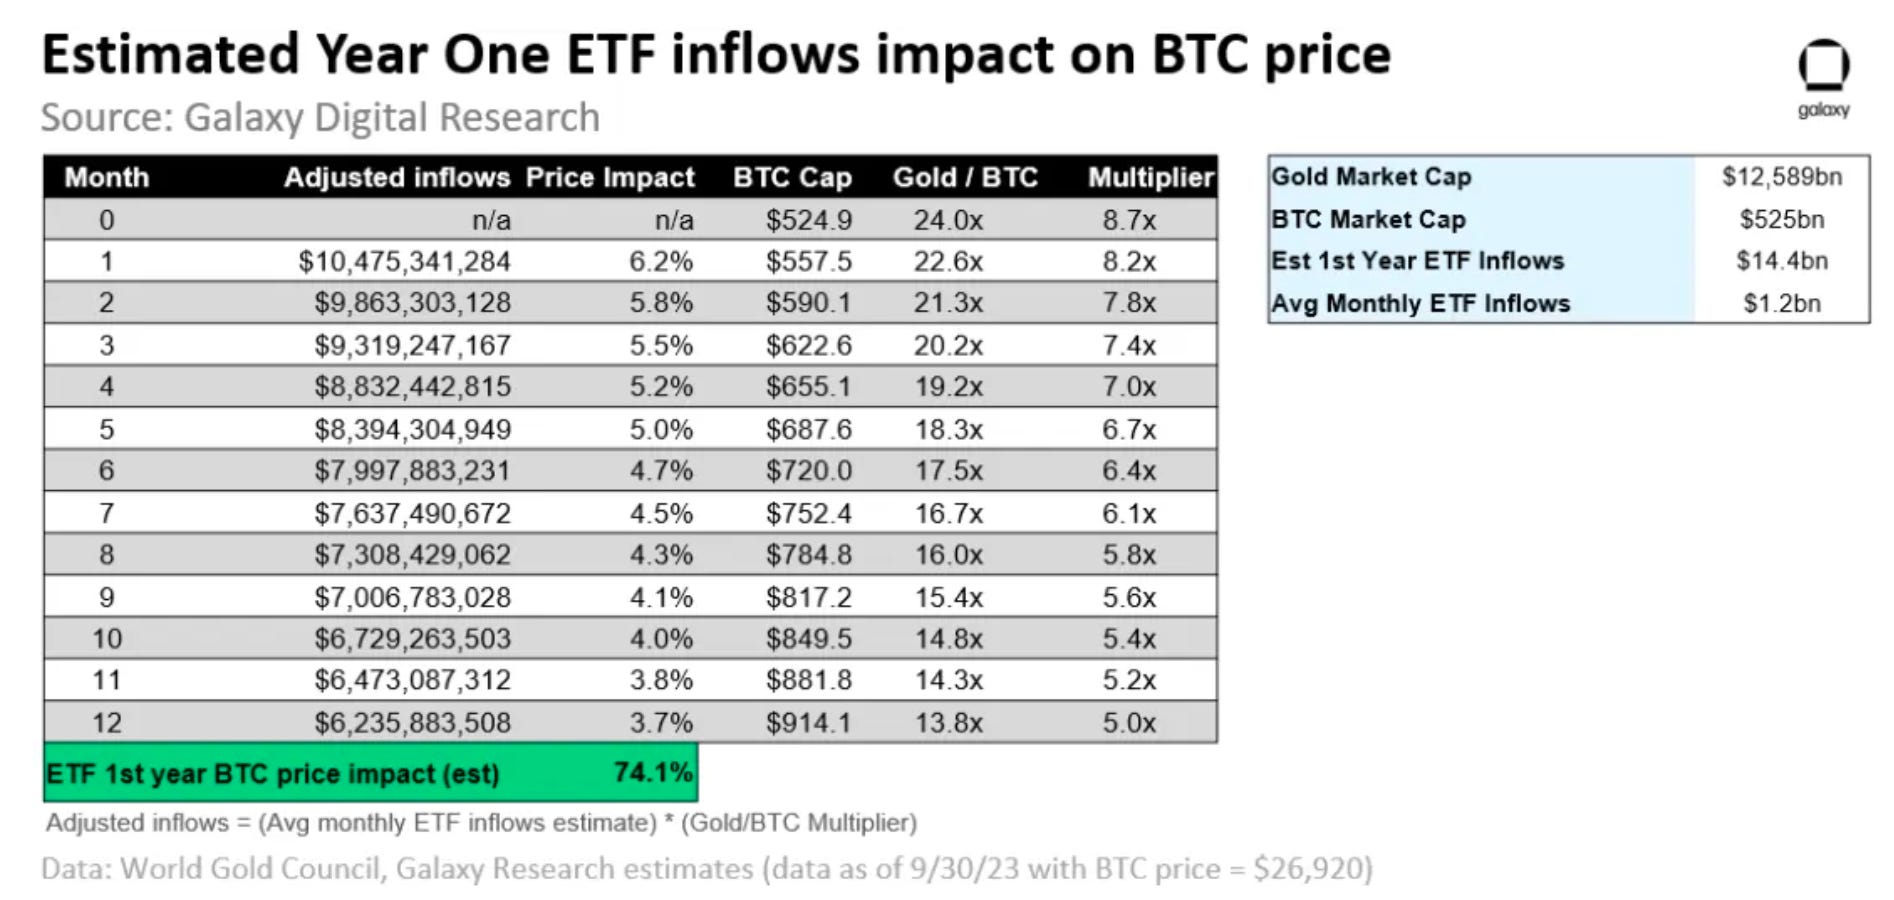
The market size potential is huge too with estimation ranging from $14T to $39T within 3 years (Source: Galaxy).
If we assume 10% of funds across all wealth platforms have an allocation to BTC and these funds allocate just 1% to BTC through a spot ETF then the estimated inflows range from $14.4B to $38.6B across Years 1-3.
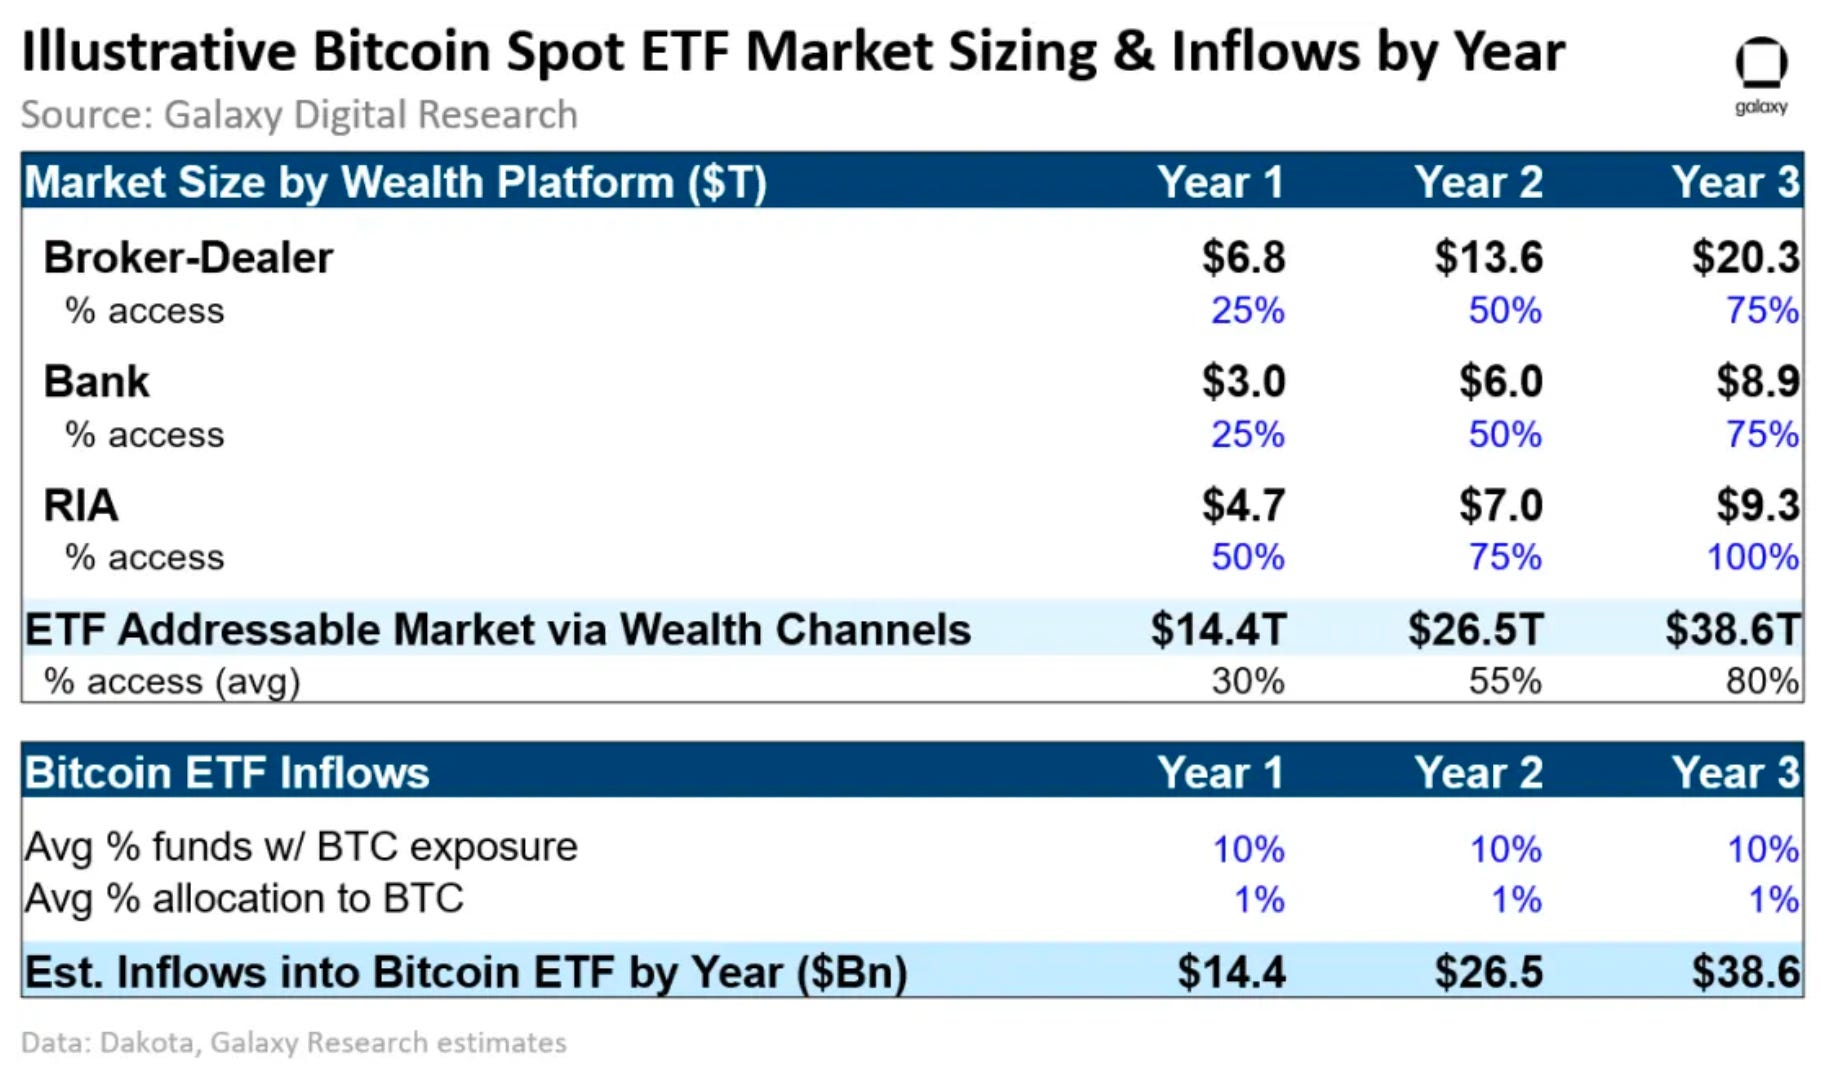
To put the volumes in perspective, Year 1 flows represent 10.9x the total market capitalisation of cryptoassets and 21.36x of Bitcoin’s market capitalisation.
The impact on price would be positive (all else equal) and using a Gold ETF price impact model, Galaxy forecasts a 19% net gain by month 3 and a 37% gain by month 6.
The key question then revolves around when a spot Bitcoin ETF will be approved by the US regulators with some calling for as early as January 2024. While regulatory clarity remains the number one challenge, the ability of wealth platforms to access safe and efficient Bitcoin exposure at scale is what keeps the hope alive.
What’s even more exciting is that it doesn’t just stop at Bitcoin. It marks the beginning of a broader institutionalisation of the industry with the world’s largest capital market. Together, the signals suggest that 2024 is shaping up to be quite the eventful year for crypto.
Catalysing Web3’s Next Adoption Cycle Through Liquidity
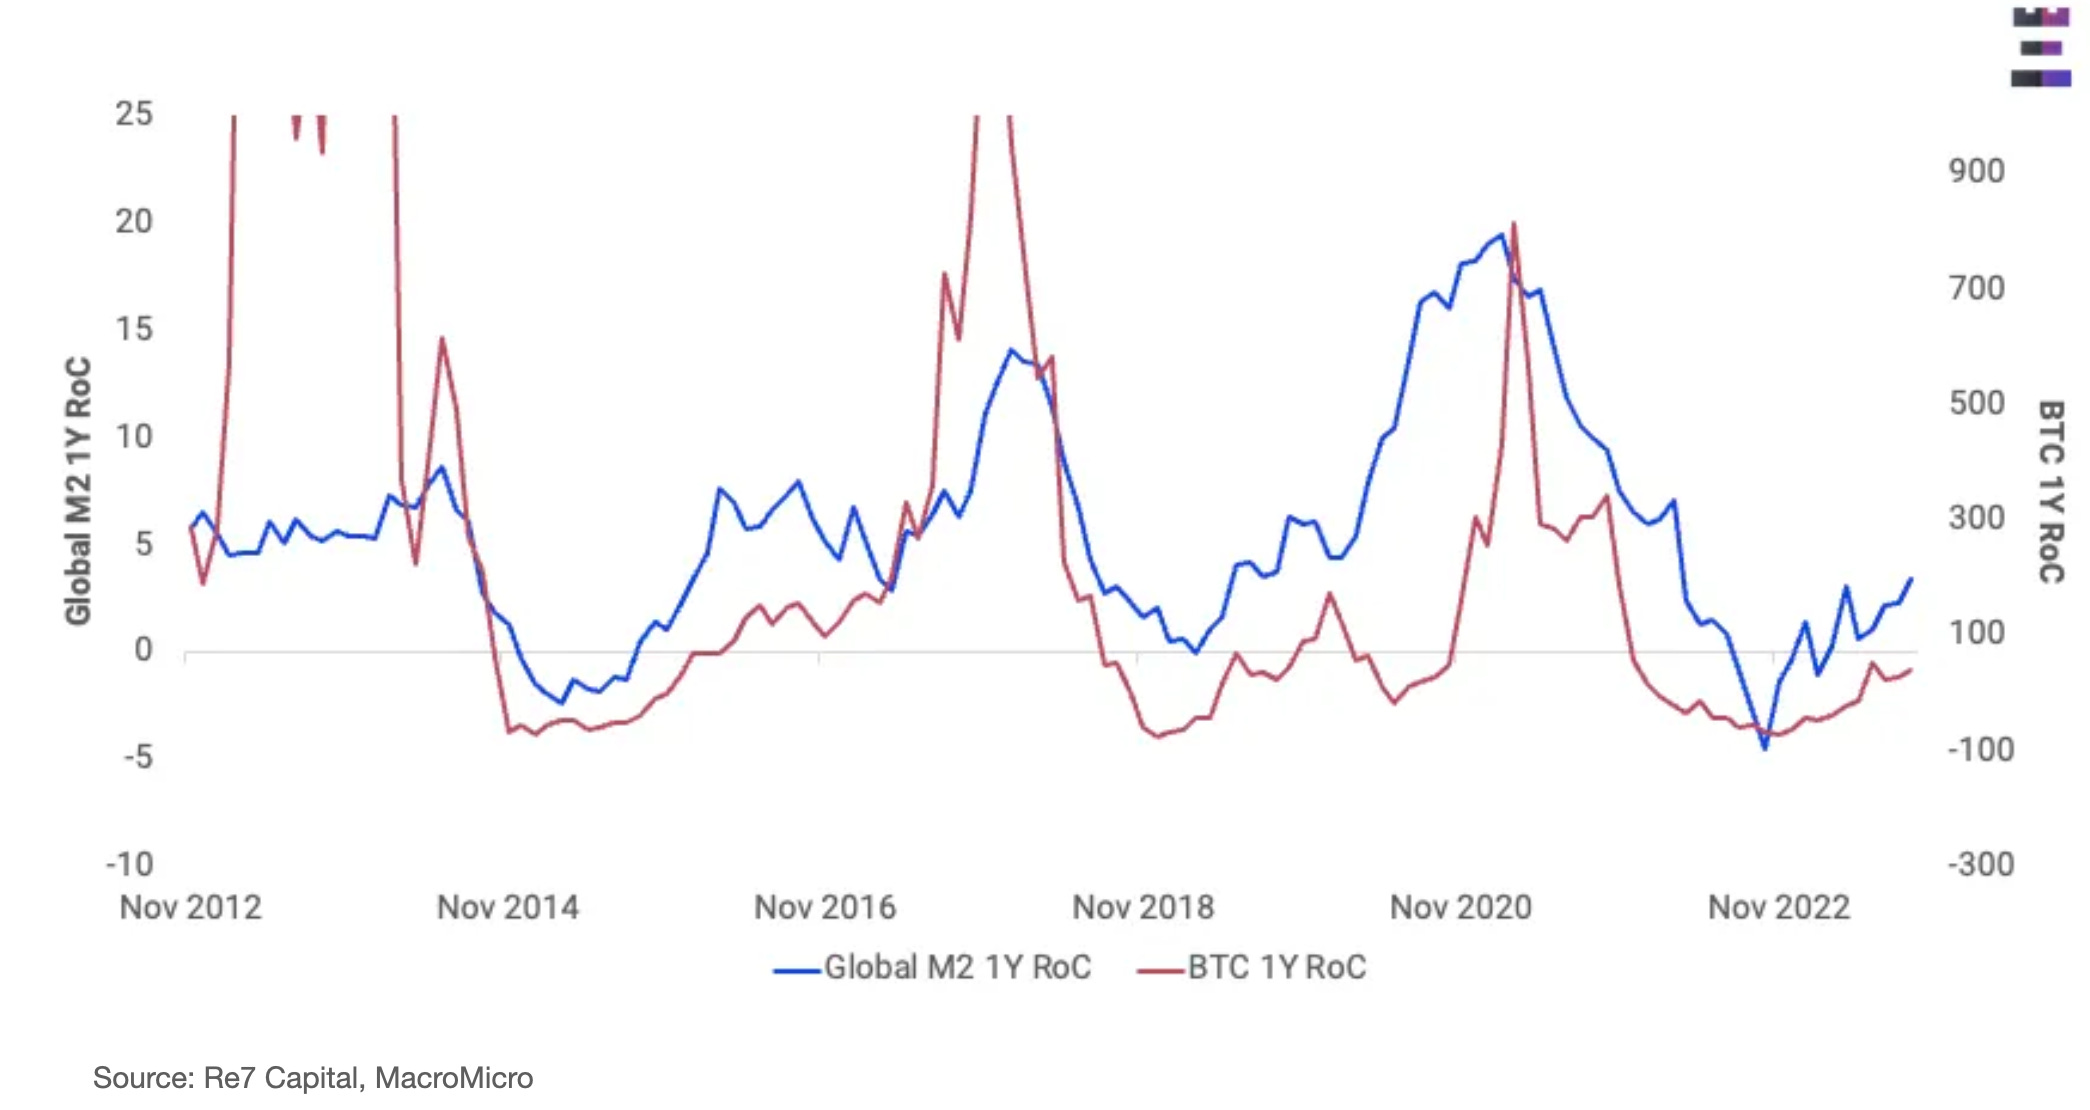
One of the key drivers of risk asset performance has been market liquidity which in turn is driven by the total money circulating in the global financial system. During expansionary periods of global M2 supply, positive asset performance ensues.
We can see that Bitcoin’s YTD performance has coincided with a recovery in M2 supply. As more money supply makes its way to the market, it flows down the risk continuum to alternative assets.
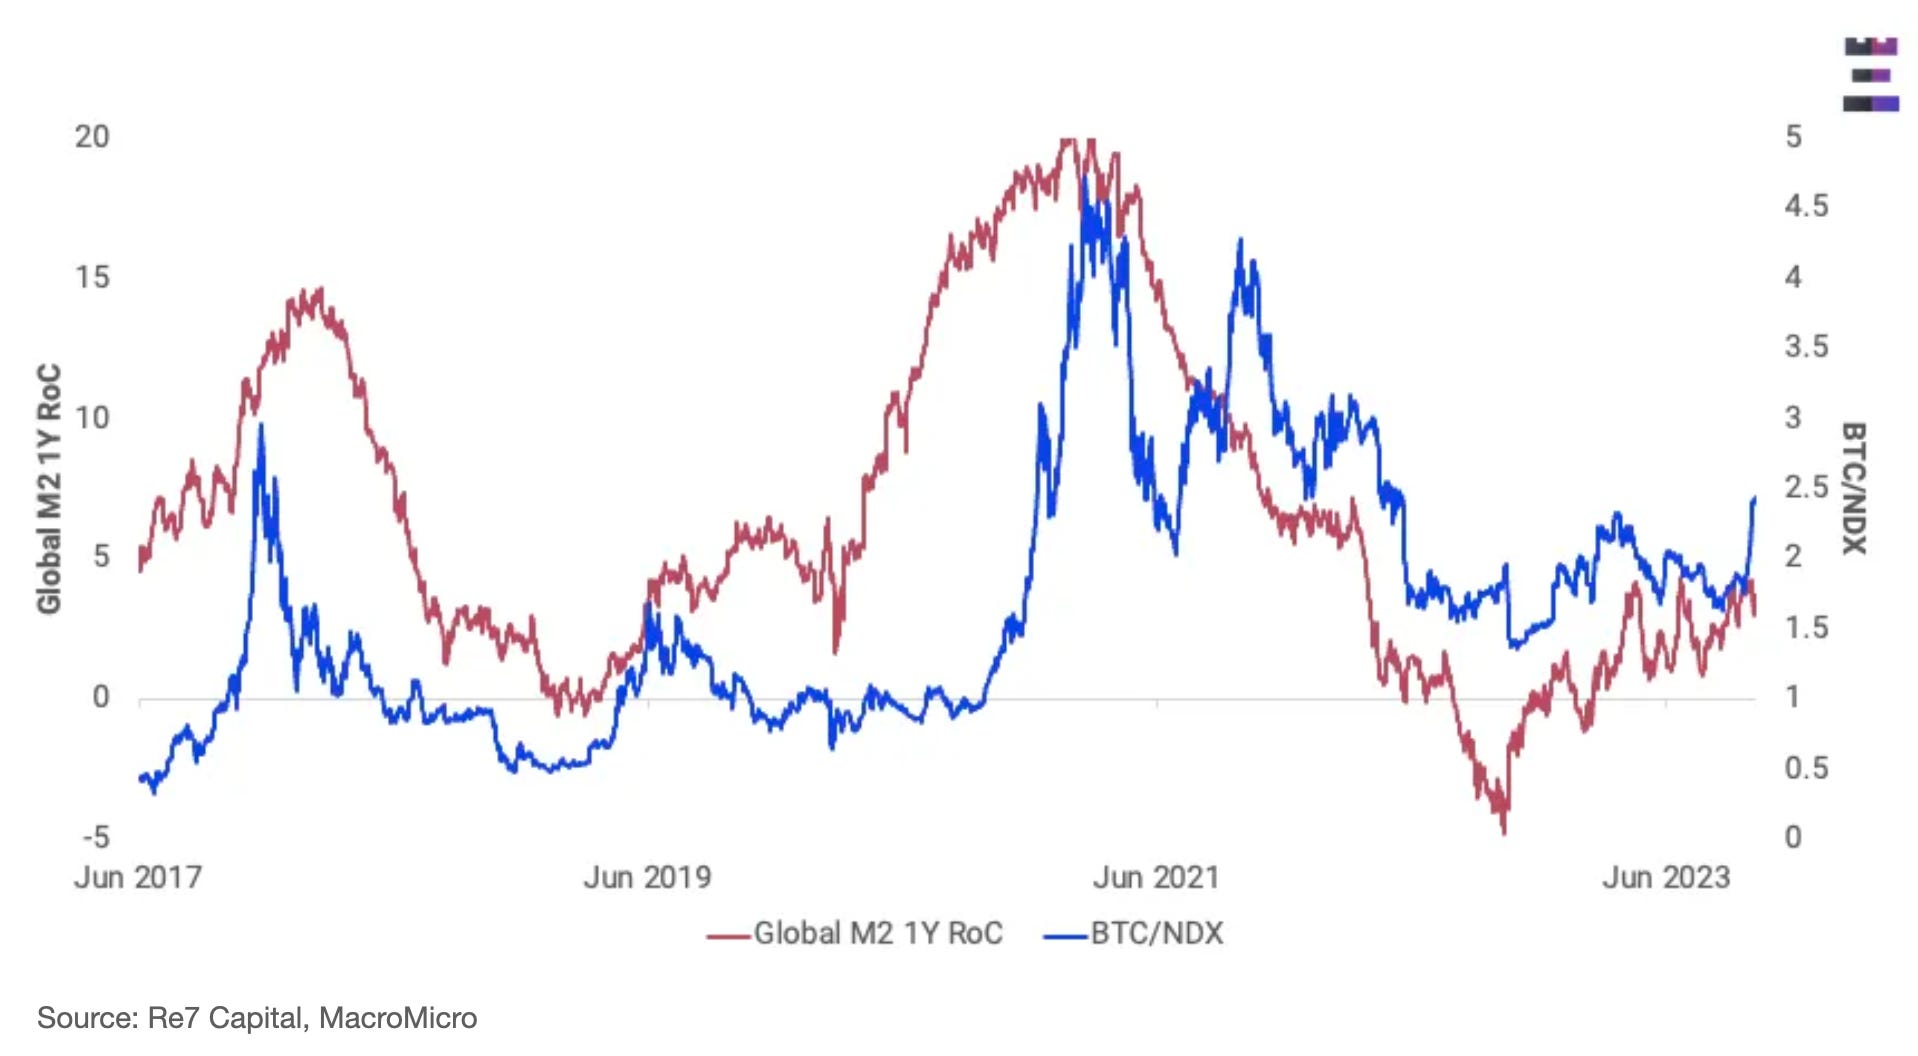
It explains why BTC tends to outperform the Nasdaq during these times too…
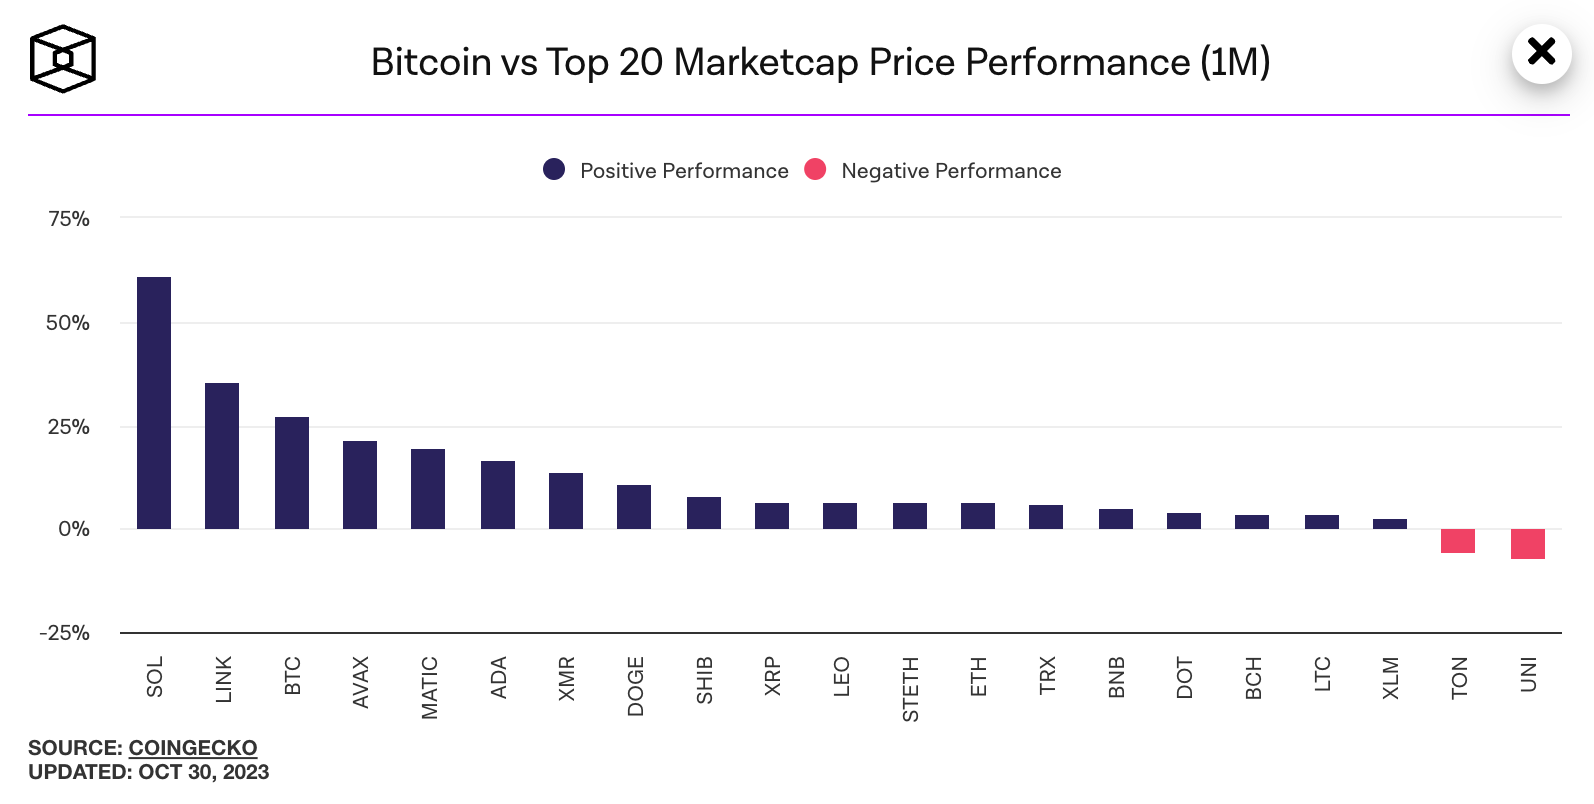
And as the logic holds, high-quality names further down the risk continuum can outperform more established names with higher market capitalisation too…
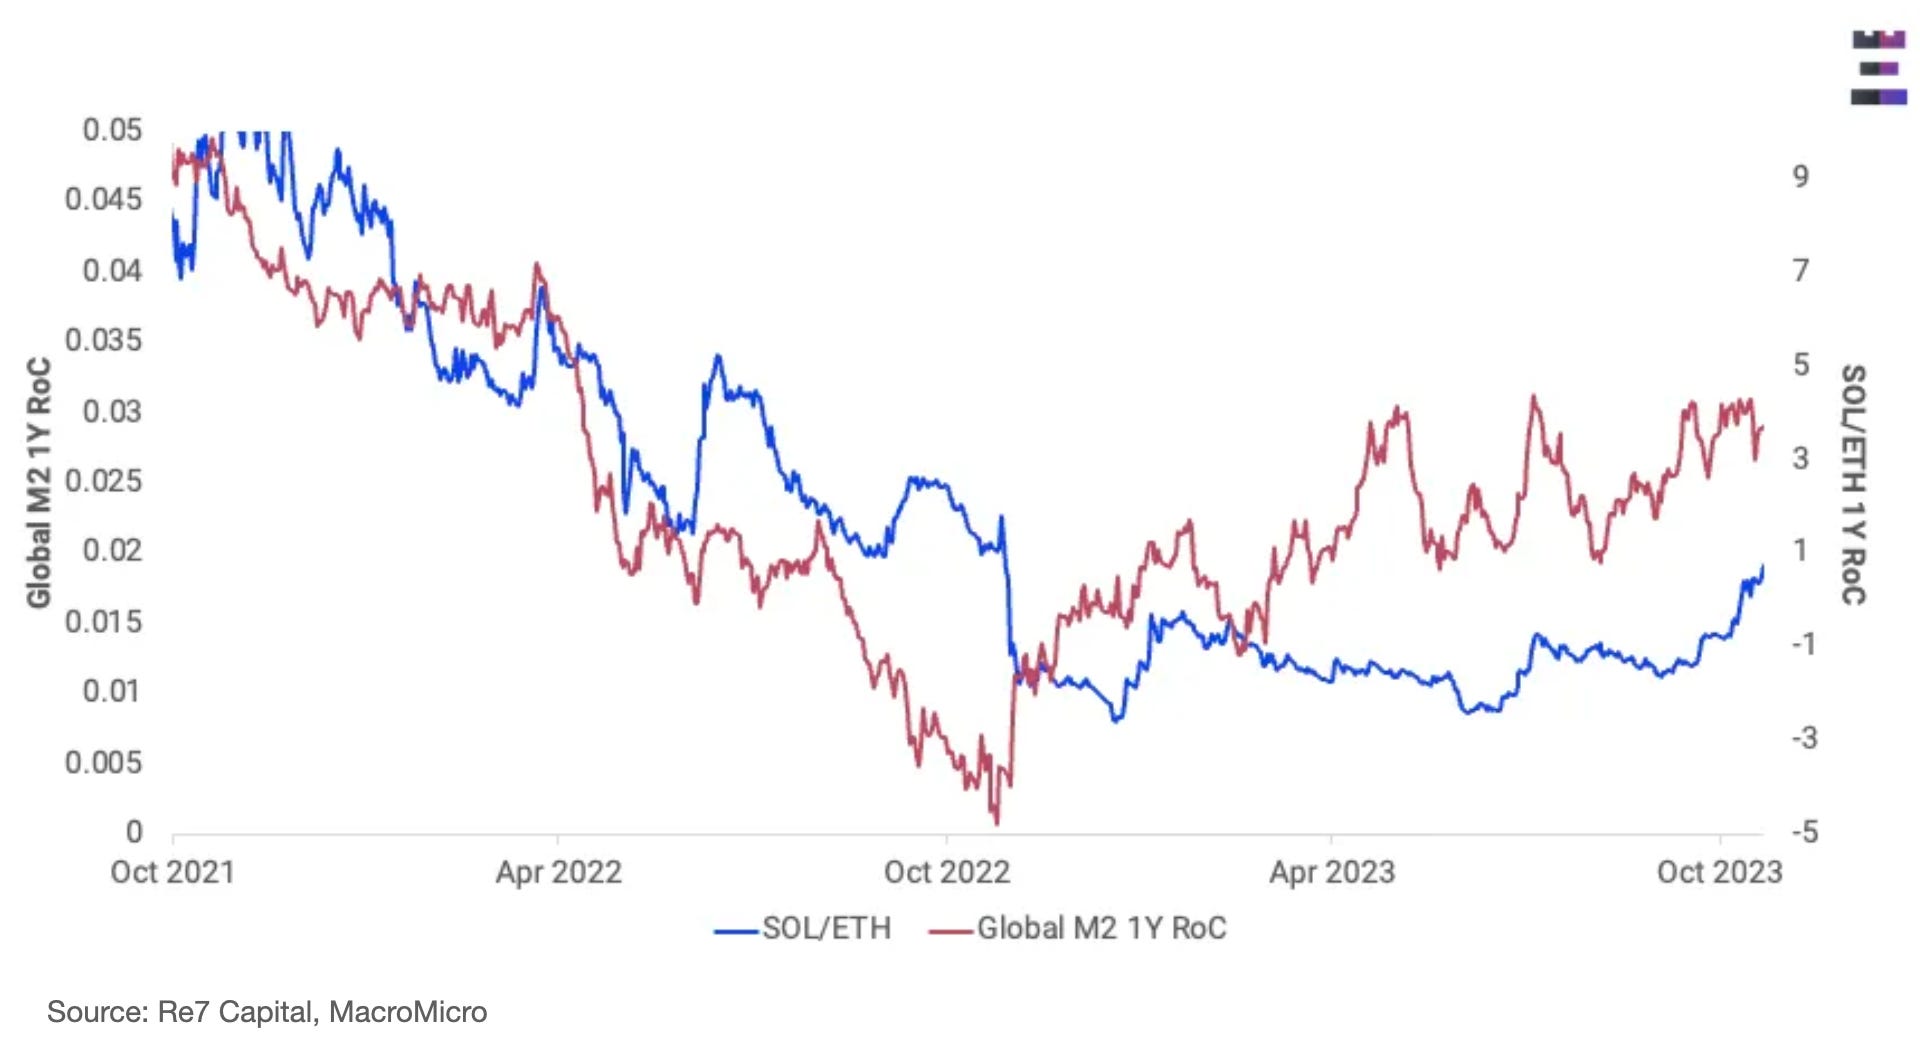
But not all assets are equal with relative performance dispersion to beta (BTC) still prevalent in the high-cap names:
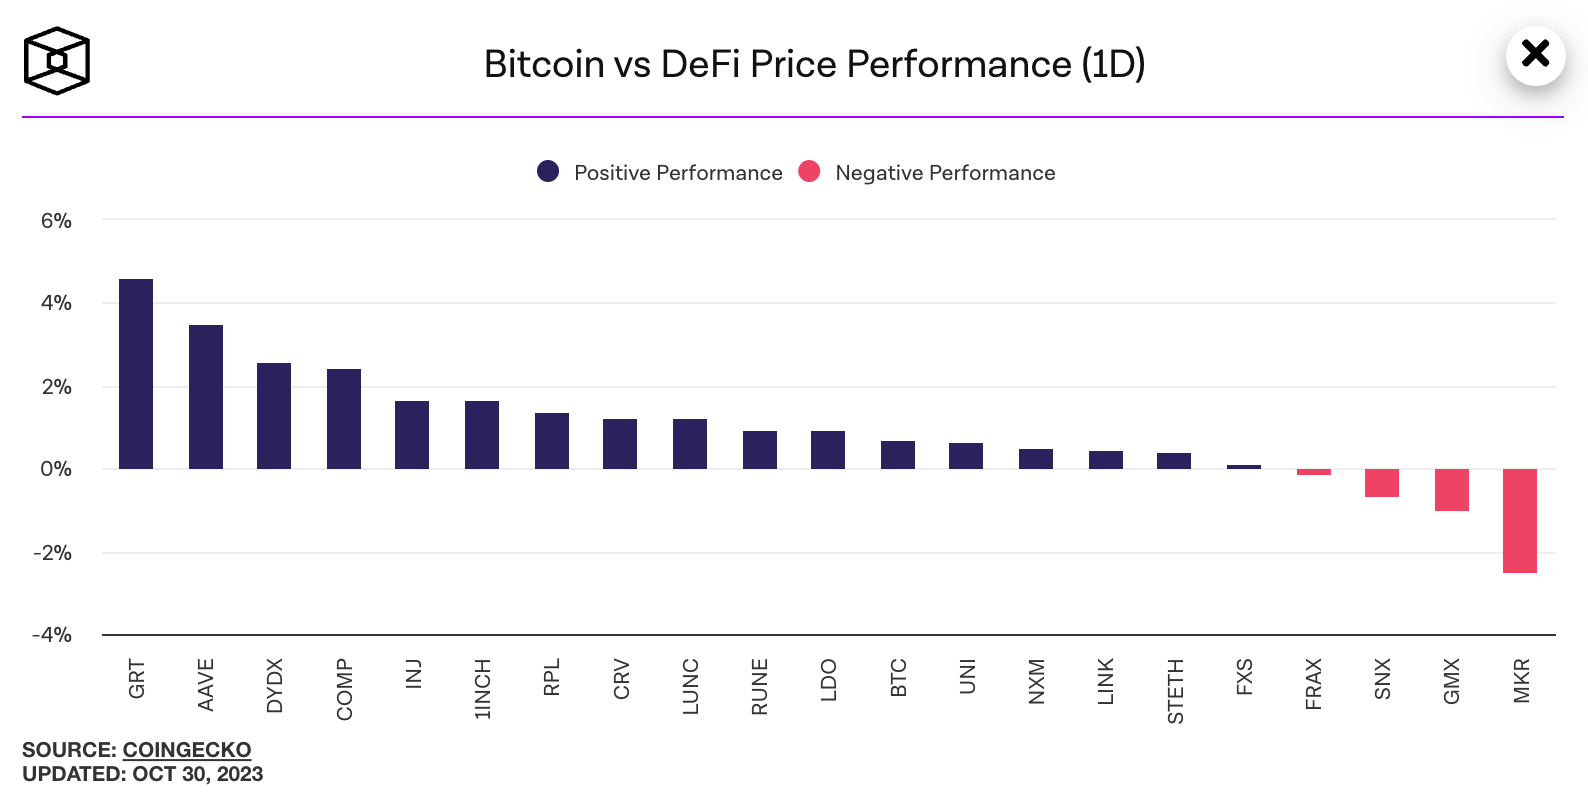
We see a similar dynamic within specific sectors too like DeFi. The environment is benefiting more active managers who are positioning around assets based on fundamentals and event catalysts.
Catalysing Web'3’s Next Adoption Cycle Through Enhanced Utility
Liquidity is only part of the adoption equation. To close the gap between the current state of Web3 and its potential requires utility and execution toward innovative possibilities and solutions.
Take yields within Decentralised Finance (DeFi) which have consistently fallen short of the rising government US treasury yields throughout 2023 - regarded as the safest asset in the world and the benchmark investment from which all other investments are compared within the financial system.
Just last week, the US 10-year note tapped 5% for the first time since June 2007.
Understanding the linkage between Web3’s emerging financial stack and the traditional markets is critical as flows move in and out of both systems.
Over time, financial products in Web3 will be able to start competing with investment opportunities in the real world, producing significant value and utility to the ecosystem.
One approach to enhance DeFi’s utility is through real-world assets where the tokenisation market size is $72B across 82 products.
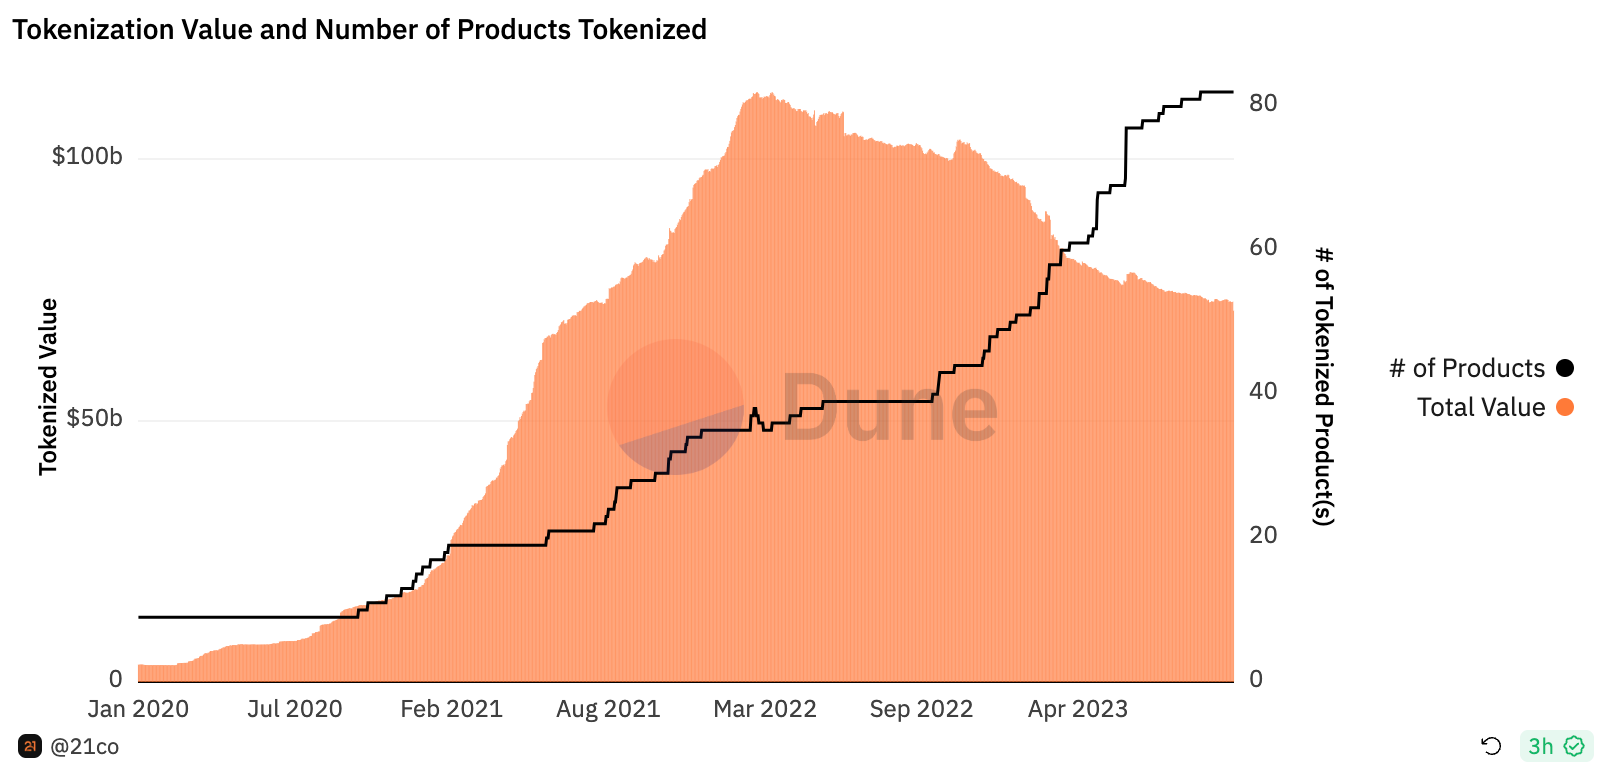
We can also measure growth on the demand side too with 200,000 new wallets holding tokenised assets every week…

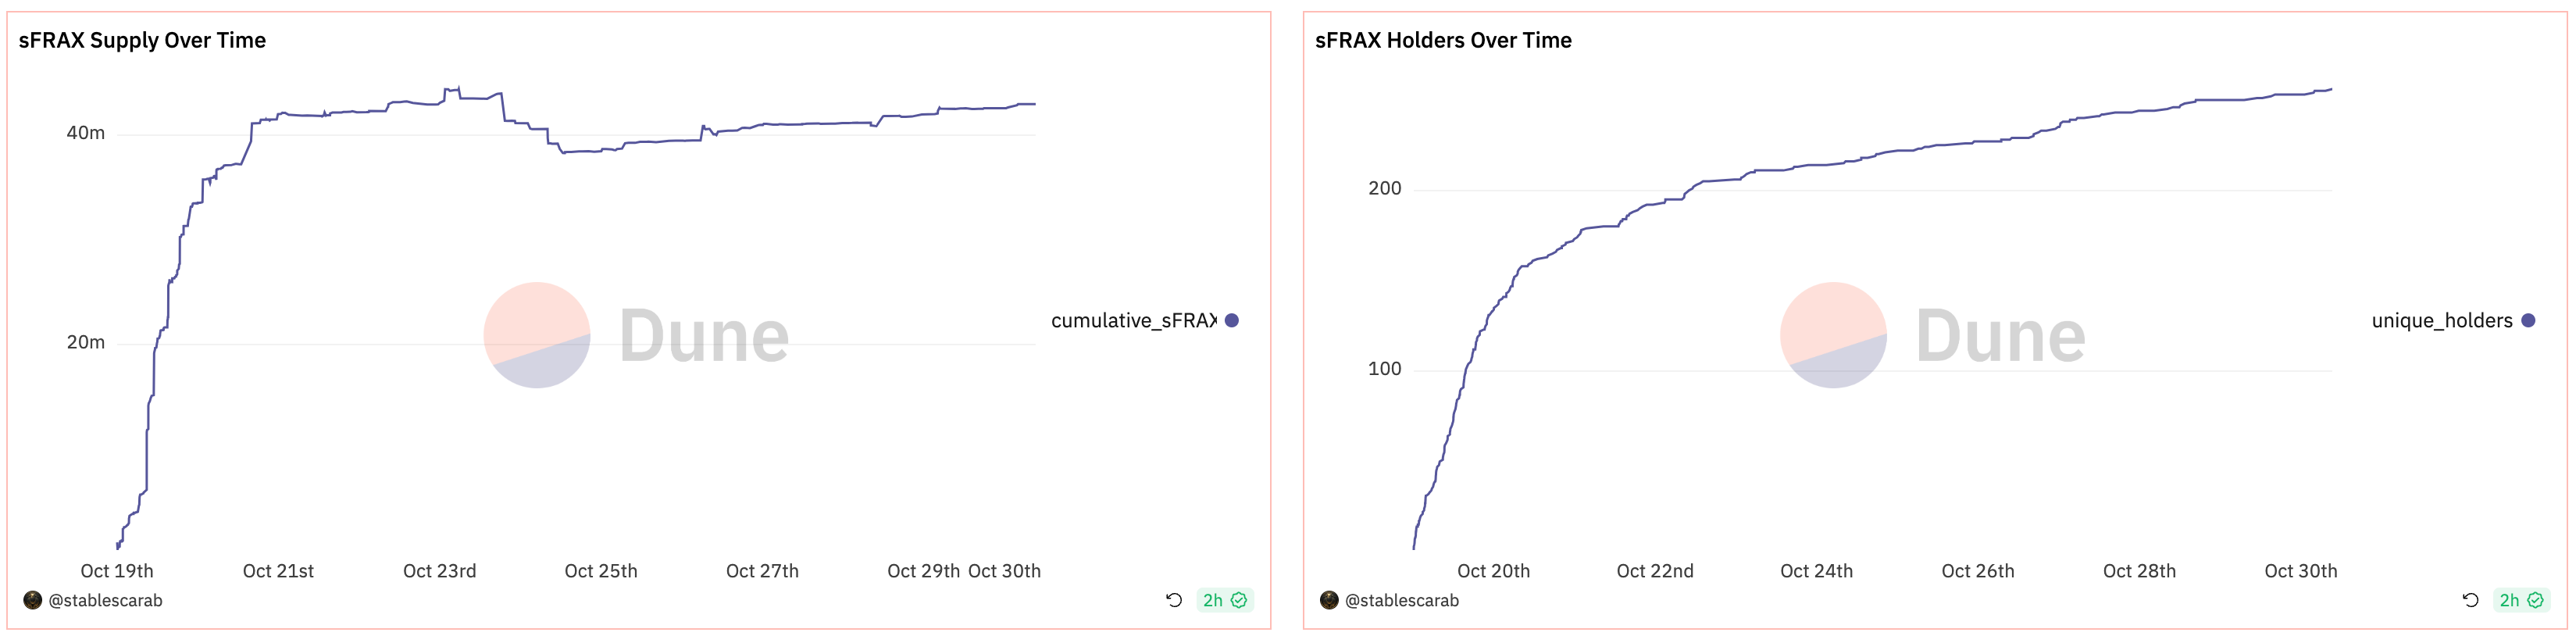
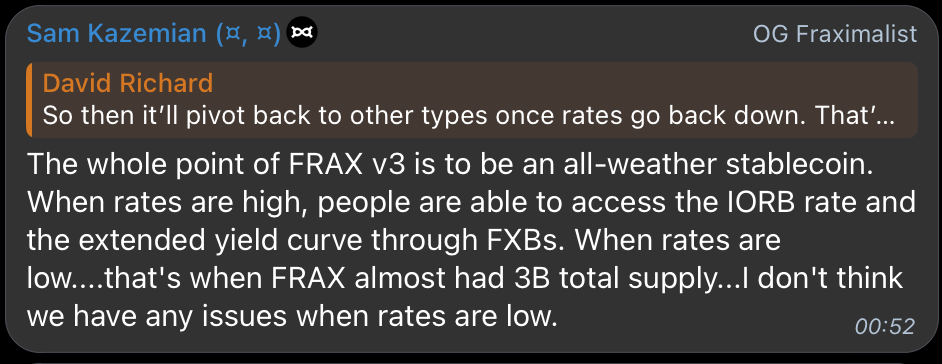
Around $700m of this value is through tokenised treasuries. The DeFi platform, Frax, launched sFRAX which allows users to stake the USD-pegged stablecoin FRAX to earn interest pegged to the Fed’s IORB rate.
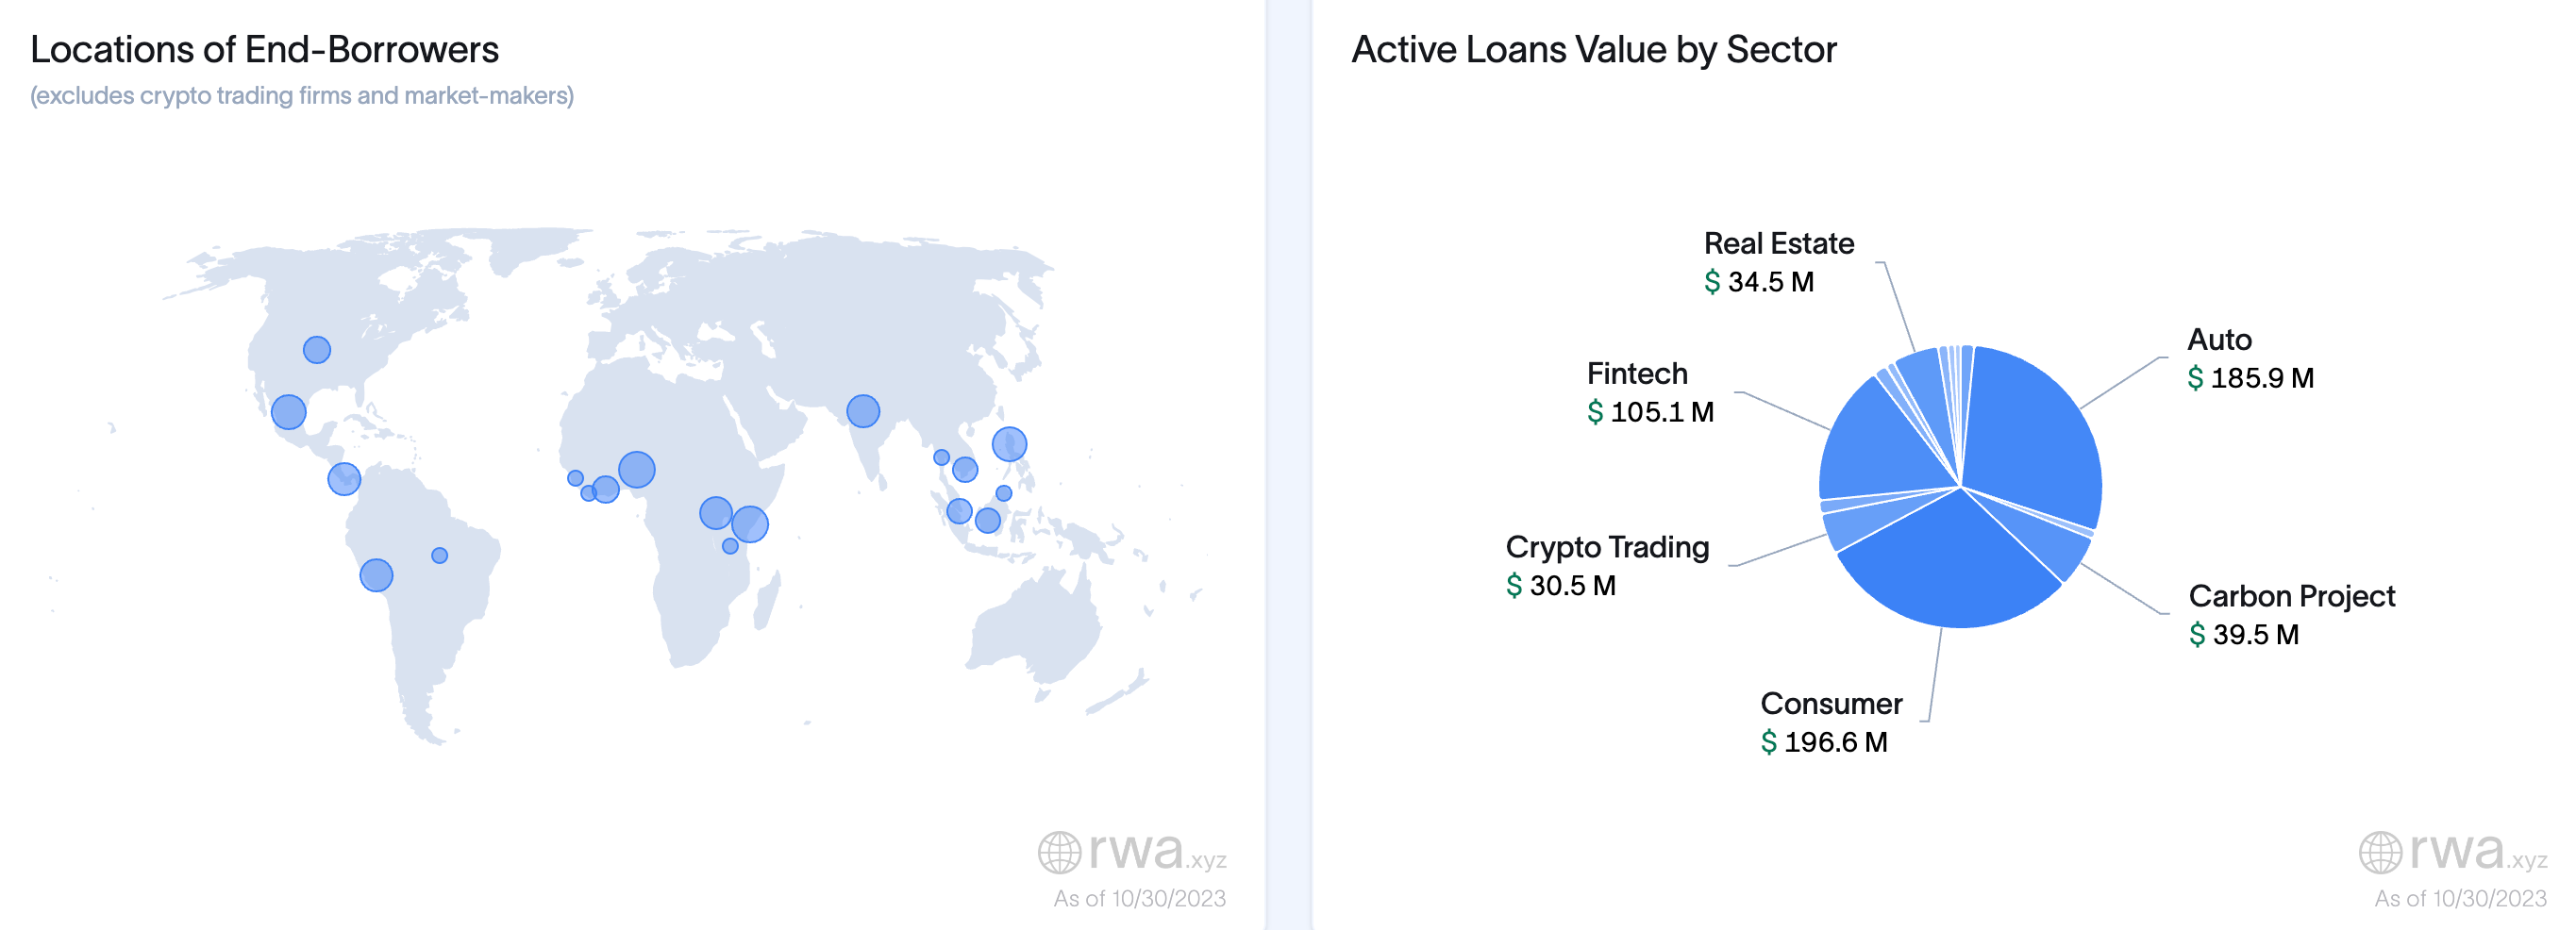
Another sector within RWAs is private credit where end-borrowers can now be seen globally taking loans cross-sector from real-estate ($35m) to fintech ($105m).
Although there are challenges for central banks to keep interest rates high for an extended period of time, DeFi no longer needs to be reliant on low-interest rates for growth.
Another avenue for enhanced utility within Web3 is through the infrastructure layer such as account abstraction (AA). In short, AA provides much more customisability and flexibility to user wallets through several means, including:
Enhances the social recovery process of wallets
The batching transaction to lower costs for users
Allowing users to pay gas fees in any token or asset (not just ETH).
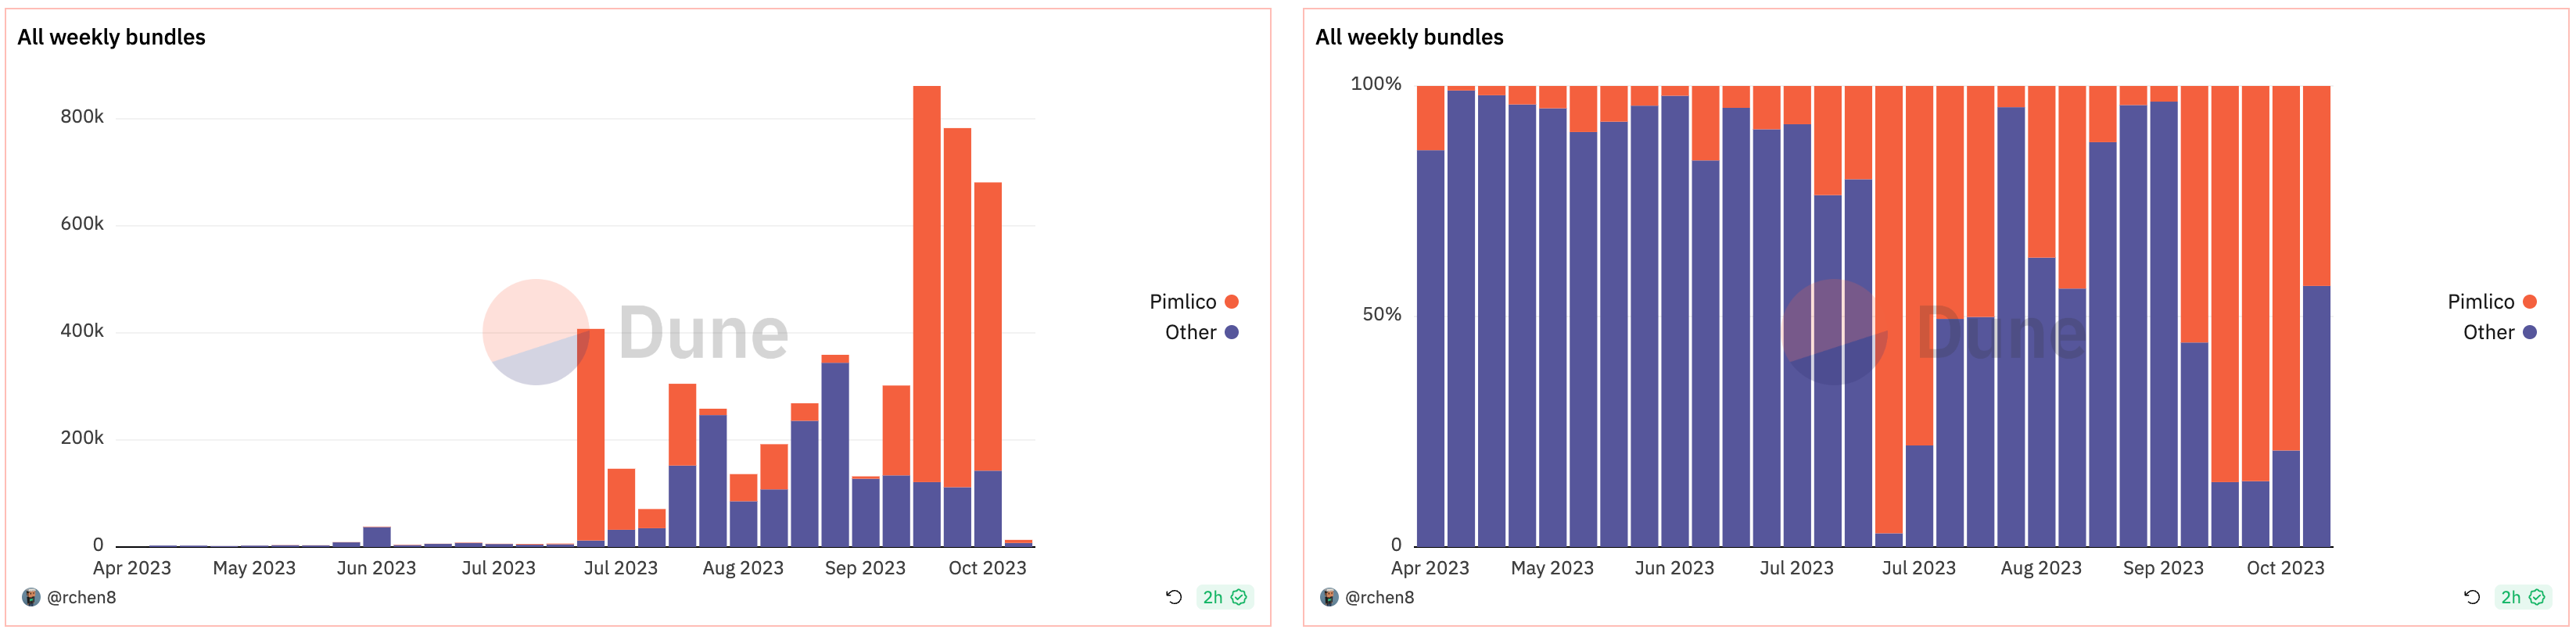
The launch of a new standard on Ethereum (ERC-4337) in March 2023 has started to see a significant breakout. The number of transactions bundled into one (bundles) for October is ~3x that of September.
Pimlico, an AA infrastructure platform, has started to see its weekly bundle market share grow over 2023 to ~50-75%.
Coming full circle, higher utility leads to a higher incentive to transact on-chain, which, in turn, drives higher valuations for the underlying blockchain ecosystem (Metcalfe’s Law).
Ethereum’s recent +15% rally since mid-October should come as no surprise after trading anywhere from 15-60% below Re7’s Metcalfe fair value index (Re7 ML) YTD.
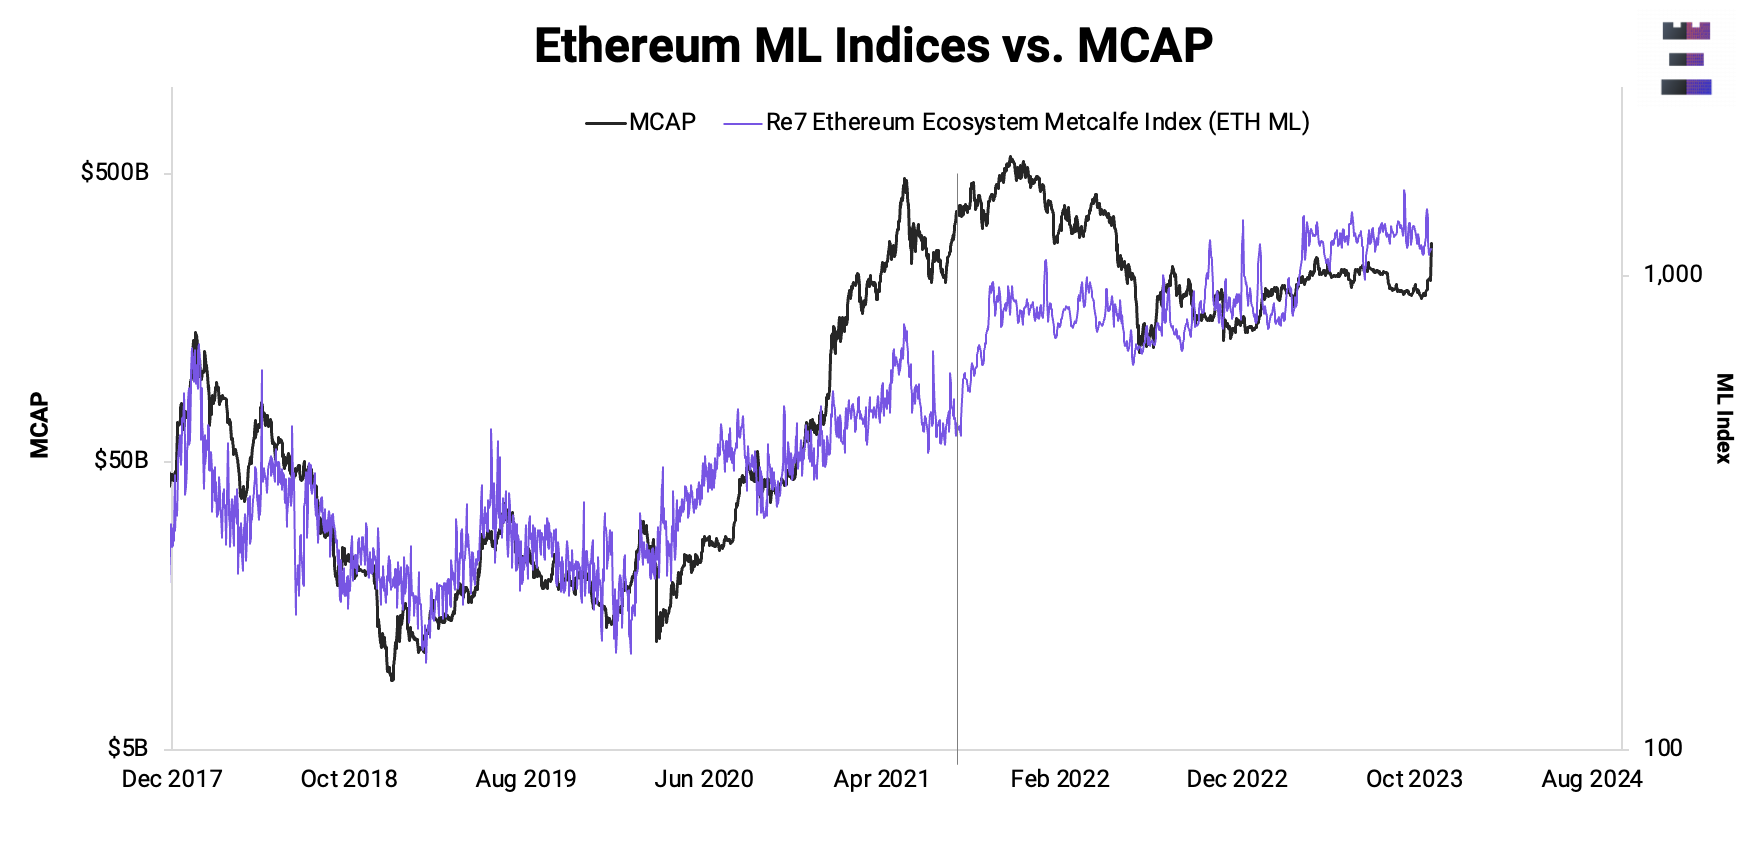
Today, ETH is still undervalued by 34% and this also assumes no further growth in active users within the Ethereum ecosystem.
The current set-up remains the same: ETH trading at a 34% discount to fair value in a high-growth potential outcome over the coming years.

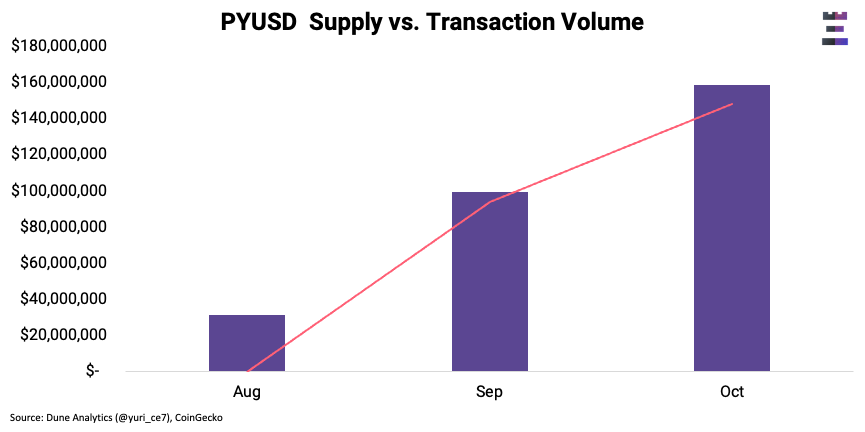
What is it? Paypal’s PYUSD stablecoin supply vs. monthly transaction volume surpassing $140m and $160m, respectively.
What’s the significance? The Web2 and Web3 convergence thesis is playing out in real-time with payment network stablecoins being tested in the wild at scale.
While still in experimentation mode, PYSD has seen over $450m in total volume since its inception. PYUSD has a direct funnel to the largest cohorts of transactors: PayPal’s 426m users and Venmo’s 70 annual active users.
Crypto.com has become the top PYSD holder (98m) as PayPal selected Crypto.com as the preferred exchange for its PYUSD stablecoin.

Aave Borrow Rates
The What: 1-month average borrow rates for stablecoins on Aave are trending around 5% and have high volatility.
The Why: Attractive yield opportunities and interest rate arbitrage around the DAI Savings Rate have pushed borrow utilization up and supply down.
What happens next: We think real-world rates continue to make their way into DeFi base rates as protocols like MakerDAO and FRAAX bring these yields on-chain.
Where's the alpha? An Aave proposal in the works will raise the base stablecoin rates, increasing supply-side yield and reducing rate volatility.

> On On-chain Real-Estate [On The Brink]
> Solana’s End Game [1000x]
> Embedding lending and credit into the fintech value proposition [The Fintech Blueprint]
> 5 Wildest Things Crypto VCs Have Invested In [Blockcrunch]
> Simon Harman: ChainFlip [Epicenter]

> Capital locked in DeFi [Coindesk]
> Sizing the digital identity market [James Monaghan]
> Future of Synthetx V3 Loans [MattLosquadro]
> Arbitrum Foundation Says 'Orbit' for Layer-3 Networks Now Ready for Mainnet [Coindesk]
> Celestia Going Live [The Block]
Disclaimers
The content is for informational purposes. None of the content is meant to be investment advice. Use your own discretion and independent decision regarding investments. The opinions expressed in all Re7 public research articles are the independent opinions of the authors at the time of publication and not the opinions of the affiliates of Re7.
Please see here for full disclaimers.